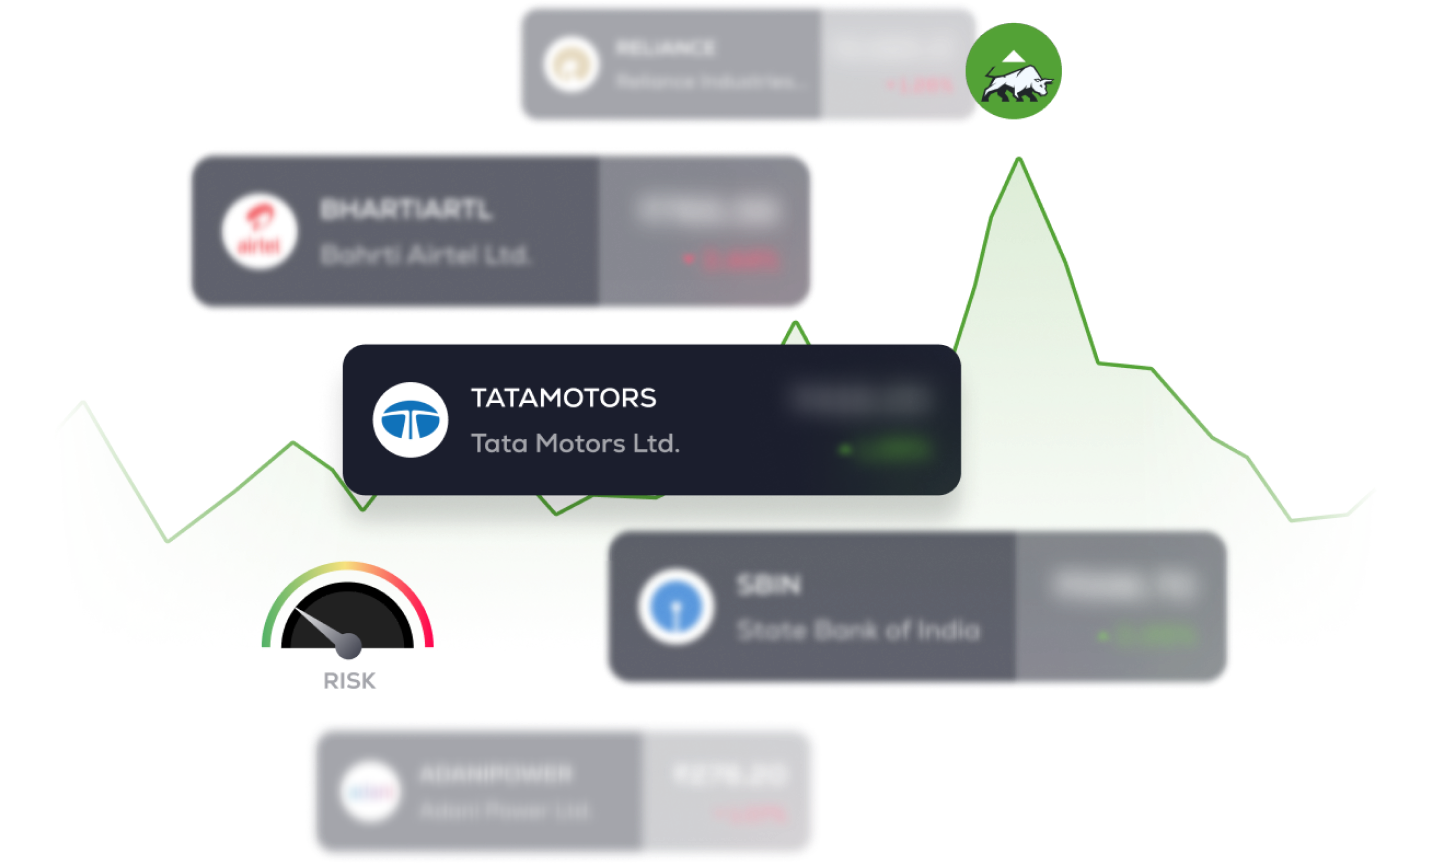
Easily analyze complex market movements
Explore top companies on the Indian stock market

Make informed investment decisions
* The price shown here are not in realtime
* The price shown here are not in realtime

Agriculture

Consumer Durables

Automobile & Ancillaries

Healthcare

Banking

Raw Material

Logisitics & Freight

IT Industry

Media & Entertainment

Apparel & Accessories

Hospitality & Travel
Derived Materials

FMCG

Energy

Tele-Communication
Financial
Invest
₹1000
in ...
1K
1L
For a period of
1M
6M
1Y
3Y
5Y
You could have earned
...
*
...
*Calculations are based on historical performance of the stock
3500+
Stocks
14+
Sectors
20+
Indian & Global Indices

1. What are stocks?
Stocks, also known as shares or equities, represent ownership in a company. When you buy stocks of a company, you become a shareholder, which means you own a tiny piece of that company.
2. Why do stock prices go up and down?
Stock prices move based on a variety of factors. Positive news about a company, industry, or the economy can boost prices. Negative news or uncertain events can cause prices to drop. Additionally, supply and demand play a role; if more people want to buy a stock, its price will rise and vice versa.
3. What are Sensex and Nifty?
Sensex and Nifty are two popular stock market indices in India. Sensex tracks the performance of 30 large and well-established companies, while Nifty tracks the performance of 50 such companies. These indices give us a bird’s eye view of the stock market’s performance.
4. Is investing in stocks risky?
Yes, investing in stocks comes with risks. Stock prices can be volatile. There is a chance of losing money, especially in the short term. However, historically, the stock market tends to provide higher returns over the long term when compared to other investment options.
5. How do I choose which stocks to buy?
Do your research! A few factors to monitor could include: a company's financial health, its management, its products or services, and its competition. It's also a good idea to diversify your investments by buying stocks from different industries, so if one industry faces a setback, your entire investment won't be affected.
6. What is a dividend?
A dividend is a portion of a company's profits paid to its shareholders. Not all companies pay dividends, but those that do often distribute them regularly, such as quarterly or annually.
7. How long should I hold onto my stocks?
The ideal holding period for stocks depends on your investment goals. Some may prefer short-term trading to make quick profits, while others aim for long-term investing, allowing their investments to grow over time.
8. Should I invest when the market is down?
Investing when the market is down, also known as buying the dip, can be a good strategy if you believe the companies you're investing in have strong long-term prospects. Be cautious and ensure you're not making impulsive decisions based solely on short-term market fluctuations.
9. What are Top Gainers and Top Losers?
Top Gainers are the stocks that have experienced the highest percentage increase in prices during a specific period. On the other hand, Top Losers are the stocks that have experienced the biggest percentage decrease in their prices during the same period.
10. How can I interpret the Detailed Stock Analysis?
The Detailed Stock Analysis provides in-depth information about a particular stock's performance. It includes data on historical price trends, trading volume, market capitalization, and more. This information can enable you to make informed decisions about investing or trading in a specific stock.
11. How do I access the Detailed Stock Analysis for a specific stock?
Explore the Detailed Stock Analysis by clicking on the stock's name or symbol in the list of gainers and losers. You can also utilize the search function on our homepage. This feature will lead you to a page with comprehensive information about that particular stock.
12. Is this information suitable for beginners?
Yes, the information is designed to be user-friendly and accessible for investors of all levels, including beginners. Our goal is to provide valuable insights minus the technical jargon.
13. Can I track these stocks over different time ranges?
Certainly! Our platform provides options to view stock performance over various time frames, from a day to several years. You can make well-informed decisions based on trends and historical performance.
Popular Stocks
Stock Categories
Top Gainers |
Top Losers
Stock Indices
Nifty 50 |
Nifty Pharma |
Nifty IT |
Sensex |
Bank Nifty
ABOUT COINSWITCH STOCKS
CoinSwitch Stocks brings you all things stocks, from insights to data and trends. Whether you’re an investor, researcher or simply curious, we offer accurate, up-to-date information to help you stay on top of the Indian stock market.
Why CoinSwitch Stocks?
Stock Data:
Stay on top of the latest market movements with accurate stock prices, trading volumes, and market data from leading exchanges.
Indian Market Coverage:
Explore the price movements and trajectories of popular Indian stocks.
Comprehensive Company Profiles:
Get a holistic view of financial metrics, historical performance, key executives and industry information.
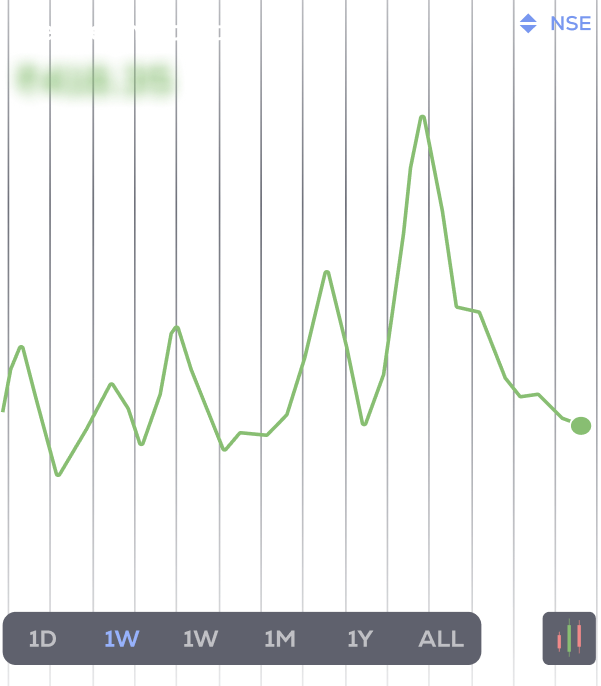
Interactive Charts:
Visualize stock performance with interactive charts. Track historical price movements by comparing companies and trends over time.
Getting Started is Easy:
Browse Stocks:
Search for specific companies by industry or market index from our comprehensive database of stocks.
View Stock Data:
Access details on prices, trading volumes, market capitalization and more for individual stocks.
Explore Company Profiles:
Understand financial performance, key statistics and industry positioning.
Analyze Performance:
Understand past performance and trends with interactive charts. Compare stock prices across different timeframes.
Empowering Informed Decision-Making
At CoinSwitch Stocks, informed decision-making is the cornerstone of successful investing. Make well-researched choices with data and insights to grow your wealth.
DISCLAIMER:
CoinSwitch electronic platform is powered by Bitkuber Investments Pvt. Ltd. (CIN: U65990KA2021PTC145060) Registered Address: Infinity, Electra Block,1st Floor, Wing A Exora Business Park, Prestige Tech Park II, Bellandur, Bengaluru - 560037, Karnataka, India. Disclaimer- Investments in securities market are subject to market risks; read all the related documents carefully before investing. Data & Content powered by CMOTS Internet Technologies Pvt. Ltd. - lSO Certified 9001:2015 website: www.cmots.com.