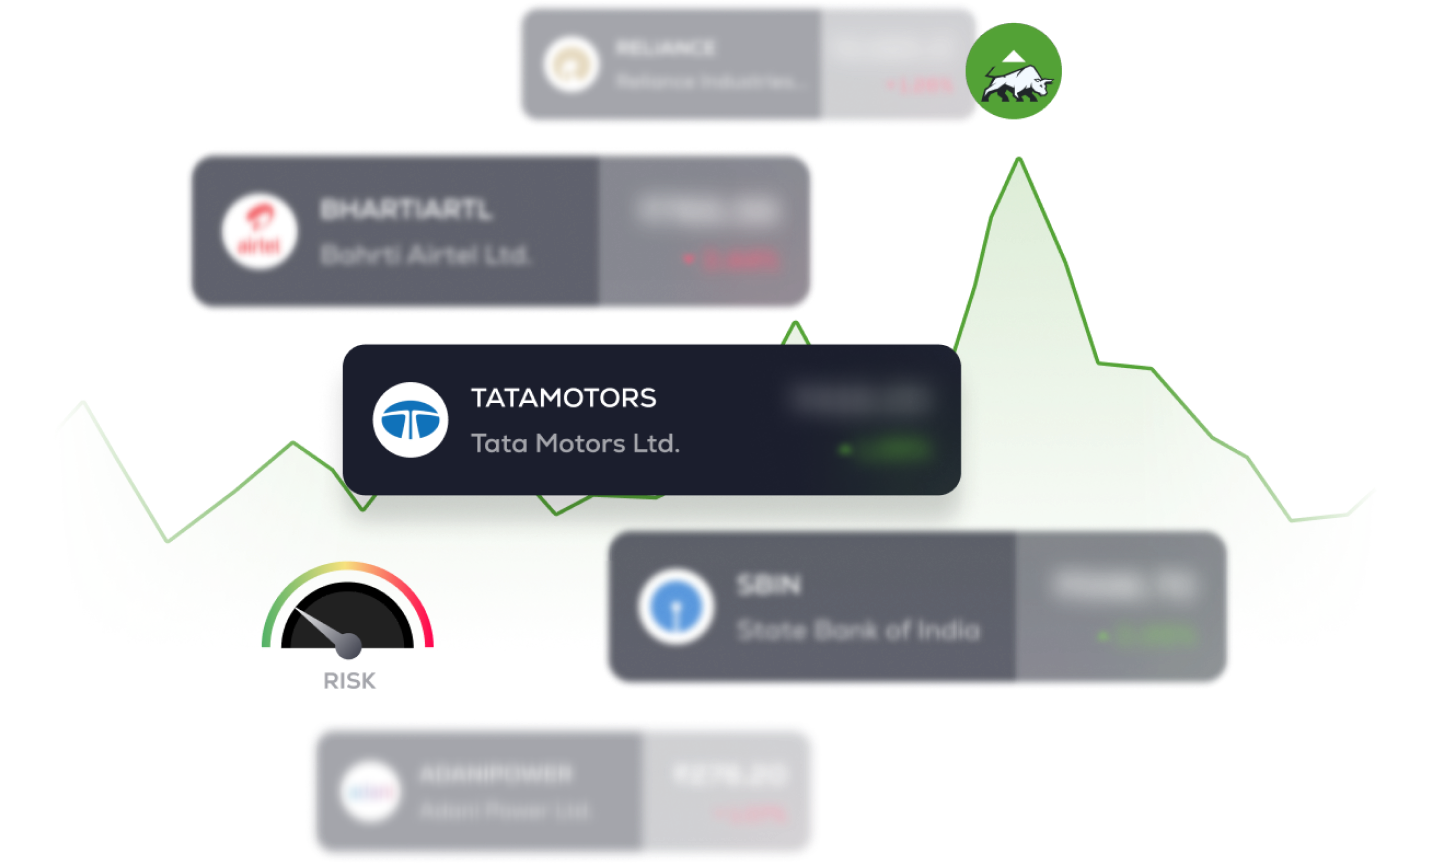
Easily analyze complex market movements
Explore top companies on the Indian stock market
Make informed investment decisions
* The price shown here are not in realtime
* The price shown here are not in realtime

Agriculture

Consumer Durables

Automobile & Ancillaries

Healthcare

Banking

Raw Material

Logisitics & Freight

IT Industry

Media & Entertainment

Apparel & Accessories

Hospitality & Travel
Derived Materials

FMCG

Energy

Tele-Communication
Financial
Invest
₹1000
in ...
1K
1L
For a period of
1M
6M
1Y
3Y
5Y
You could have earned
...
*
...
*Calculations are based on historical performance of the stock
3500+
Stocks
14+
Sectors
20+
Indian & Global Indices

1. What are stocks?
Stocks, also known as shares or equities, represent ownership in a company. When you buy stocks of a company, you become a shareholder, which means you own a tiny piece of that company.
2. Why do stock prices go up and down?
Stock prices move based on a variety of factors. Positive news about a company, industry, or the economy can boost prices. Negative news or uncertain events can cause prices to drop. Additionally, supply and demand play a role; if more people want to buy a stock, its price will rise and vice versa.
3. What are Sensex and Nifty?
Sensex and Nifty are two popular stock market indices in India. Sensex tracks the performance of 30 large and well-established companies, while Nifty tracks the performance of 50 such companies. These indices give us a bird’s eye view of the stock market’s performance.
4. Is investing in stocks risky?
Yes, investing in stocks comes with risks. Stock prices can be volatile. There is a chance of losing money, especially in the short term. However, historically, the stock market tends to provide higher returns over the long term when compared to other investment options.
5. How do I choose which stocks to buy?
Do your research! A few factors to monitor could include: a company's financial health, its management, its products or services, and its competition. It's also a good idea to diversify your investments by buying stocks from different industries, so if one industry faces a setback, your entire investment won't be affected.
6. What is a dividend?
A dividend is a portion of a company's profits paid to its shareholders. Not all companies pay dividends, but those that do often distribute them regularly, such as quarterly or annually.
7. How long should I hold onto my stocks?
The ideal holding period for stocks depends on your investment goals. Some may prefer short-term trading to make quick profits, while others aim for long-term investing, allowing their investments to grow over time.
8. Should I invest when the market is down?
Investing when the market is down, also known as buying the dip, can be a good strategy if you believe the companies you're investing in have strong long-term prospects. Be cautious and ensure you're not making impulsive decisions based solely on short-term market fluctuations.
9. What are Top Gainers and Top Losers?
Top Gainers are the stocks that have experienced the highest percentage increase in prices during a specific period. On the other hand, Top Losers are the stocks that have experienced the biggest percentage decrease in their prices during the same period.
10. How can I interpret the Detailed Stock Analysis?
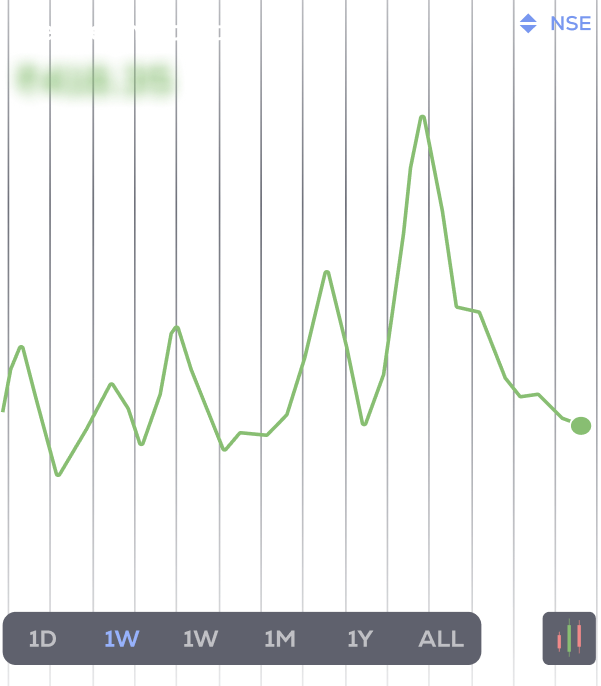
The Detailed Stock Analysis provides in-depth information about a particular stock's performance. It includes data on historical price trends, trading volume, market capitalization, and more. This information can enable you to make informed decisions about investing or trading in a specific stock.
11. How do I access the Detailed Stock Analysis for a specific stock?
Explore the Detailed Stock Analysis by clicking on the stock's name or symbol in the list of gainers and losers. You can also utilize the search function on our homepage. This feature will lead you to a page with comprehensive information about that particular stock.
12. Is this information suitable for beginners?
Yes, the information is designed to be user-friendly and accessible for investors of all levels, including beginners. Our goal is to provide valuable insights minus the technical jargon.
13. Can I track these stocks over different time ranges?
Certainly! Our platform provides options to view stock performance over various time frames, from a day to several years. You can make well-informed decisions based on trends and historical performance.
LEGAL DISCLAIMER:
The online broking service is provided by NU Investors Technologies Private Limited | CIN: U67200MH2021PTC364704 | SEBI Registration no.: INZ000304837 |Validity of Registration: March 04, 2022 - Perpetual l NSE Member Code: 90251 l NSE Clearing Member code: M70032 l BSE Member Code: 6813 l CDSL Member Code :IN-DP-712-2022.
Our Terms of Use|
Privacy Policy|
KYC - AML Policy|
Investor Charter|
Policies & Procedure|
Regulatory & Other Information|
Investor Grievance & Escalation Matrix.
Registered Address: 601, Heritage Plaza, 6th Floor, JP Road Opp. Indian Oil Colony, Andheri (West), Mumbai - 400058, Maharashtra, India.
Telephone Number:
Email ID:
ATTENTION INVESTORS:
1. Margins:
1) Stock brokers can accept securities as margins from clients only by way of pledge in the depository system w.e.f September 01, 2020.
2) Update your mobile number & email Id with your stock broker / depository participant and receive OTP directly from depository on your e-mail and/or mobile number to create pledge.
3) Pay 20% upfront margin of the transaction value to trade in cash market segment.
4) Investors may please refer to the Exchange's Frequently Asked Questions (FAQs) issued vide circular reference NSE/INSP/45191 dated July 31, 2020 and NSE/INSP/45534 dated August 31, 2020 and other guidelines issued from time to time in this regard.
5) Check your securities / MF / bonds in the consolidated account statement issued by NSDL/CDSL every month. Issued in the interest of Investors.
2. Prevention of unauthorised transactions in your account:
Update your mobile numbers/email IDs with your stock brokers. Receive information of your transactions directly from Exchange on your mobile/email at the end of the day. Issued in the interest of Investors.
3. KYC Registration:
KYC is one time exercise while dealing in securities markets - once KYC is done through a SEBI registered intermediary (broker, DP, Mutual Fund etc.), you need not undergo the same process again when you approach another intermediary.
DISCLAIMER:
Investments in securities market are subject to market risks; read all the related documents carefully before investing.
Margin Trading is offered as subject to the provisions of SEBI Circular CIR/MRD/DP/54/2017 dated June 13, 2017 and the terms and conditions mentioned in rights and obligations statement issued by NU Investors Technologies Private Limited.
Procedure to file a complaint on SEBI SCORES: Register on SCORES portal. | Mandatory details for filing complaints on SCORES: Name, PAN, Address, Mobile Number, E-mail ID. | Benefits: Effective Communication, Speedy redressal of the grievances.
© 2021 - 2023 NU Investors Technologies Private Limited l All rights reserved.