
Solana Overview
Solana is a blockchain platform designed for decentralized applications (DApps) and crypto projects. It’s known for its high throughput and low transaction costs. Unlike some other blockchains, Solana uses a unique consensus mechanism called Proof of History (PoH) in conjunction with Proof of Stake (PoS). This combination allows for faster transaction confirmation times and scalability.
Imagine Solana as a bustling highway where transactions zoom by quickly and at a lower cost compared to some other blockchain networks. The efficiency stems from its innovative approach to consensus and overall architecture.
Developers often choose Solana for projects that require high-speed transactions and low fees, making it a popular choice in the rapidly evolving world of decentralized finance (DeFi) and other blockchain applications.
Solana (SOL) Technical Overview
| Attribute | Details |
| Category | Layer 1 blockchain |
| Description | Solana is a high-performance blockchain supporting builders around the world creating crypto apps that scale today. |
| Launch Date | March 16, 2020 |
| Consensus Mechanism | Proof of Stake (PoS) |
| Current Supply | 565,885,584.7476015 SOL |
| Circulating Supply | 428,712,814.2177652 SOL |
| Price (Approx.) | 100.78 USD (as of 29th January, 2024) |
| 24h Trading Volume | $4,446,732,548.29 |
| Active Markets | 563 |
| Website | https://solana.com/ |
| Whitepaper | https://solana.com/solana-whitepaper.pdf |
| https://reddit.com/r/solana | |
| Source Code | https://github.com/solana-labs |
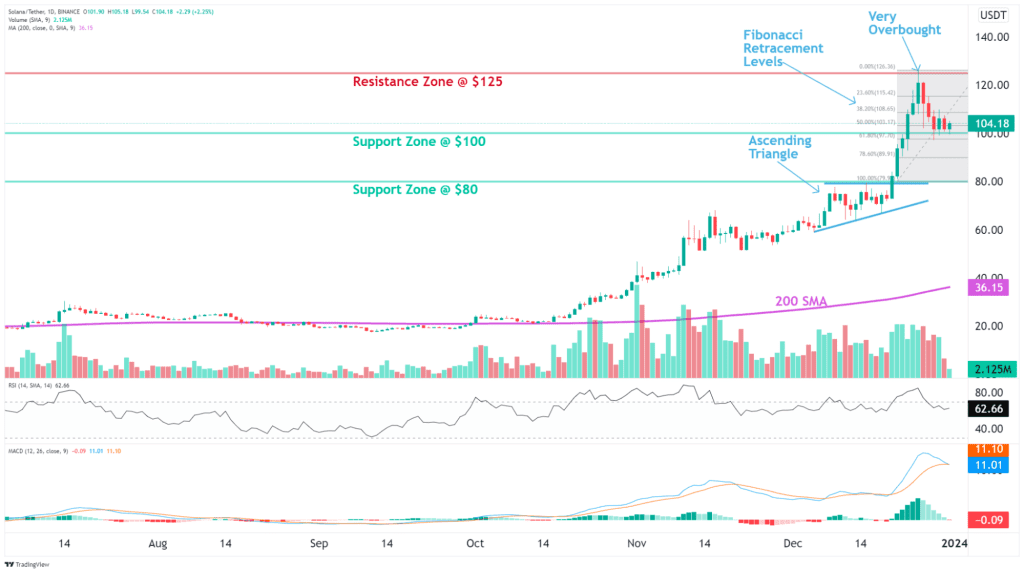
Price Action:
Solana price prediction following a bullish breakout from Ascending Triangle:
Price reached $125 last month (Dec), but got very overbought (RSI ~ 83) and pulled back on profit-taking.
A pullback to near $100 support could be a swing trade entry in the Uptrend, with upside potential back to $125. Stop Loss (SL) level at $88.
Nearest Fibonacci Retracement levels (possible support) are $103 (50%) and $98 (61.80%). (set a price alert)
Trend: Uptrend across all time horizons.
Momentum is Mixed as the MACD Line is below the MACD Signal Line (Bearish) but RSI > 55 (Bullish).
Levels: Support and Resistance Nearest Support Zone is $100 (previous resistance), then $80. The nearest Resistance Zone is $125.
Solana Profit Calculator
Solana profit calculator will help you calculate your profit/loss from trading. The calculator is especially useful when you are dealing with a large number of tokens and multiple trades which also involves other calculations like exchange fees. The calculator helps you assess your net profit/loss on your Solana trades. Check out the link – Click Here
Solana Historical
Solana, a blockchain platform publicly launched in March 2020, employs innovative features like Proof of History (PoH) and Proof of Stake (PoS). Its unique consensus mechanism, PoH, records transaction orders and timestamps before adding them to the blockchain, enhancing transaction speed and scalability.
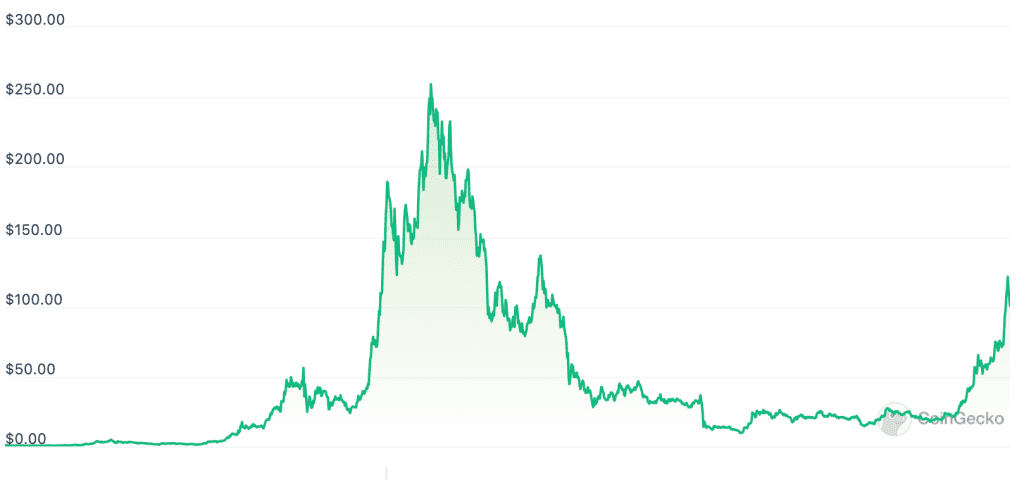
The historical data of Solana’s price can be tracked to make Solana price predictions. Solana started in 2020 at a lower value, with a significant increase in 2023, reaching its peak in November.
In the sections that follow, we bring you our Solana price prediction starting with 2024 up to 2050, based on third-party sources. We have done our due diligence on the reliability and accuracy of the third-party sources relied upon and such sources cannot reasonably be considered misleading for the users. Please note that given the volatility of the crypto market, prices could move upward or downward. Returns are not guaranteed.
Solana Price Prediction 2024
In 2024, Solana’s price is projected to vary between $111.60 and $132.97, signaling considerable volatility and inherent uncertainty within the cryptocurrency market.
Although making precise predictions is difficult, our prediction model suggests that, on average, the cost of SOL is expected to stabilize at approximately $113.93 during this timeframe. (Source: Here)
Solana Price Prediction 2025
As per our SOL price prediction, Solana’s value will not fall below the minimum threshold of $165.35 in 2025.
The Solana price prediction for the year suggests that the SOL price could experience a surge, reaching a peak trading value of $195.14. This underscores the substantial growth potential that experts envision for Solana. Throughout 2025, the average trading price for Solana is anticipated to remain at approximately $168.77. (Source: Here)
Solana Price Prediction 2026
Solana holds potential for significant growth, as SOL price prediction for 2026 indicates a maximum price of approximately $283.33 during the timeframe. This peak value indicates the anticipated upward momentum that Solana may experience during the year. The estimated minimum price for Solana (SOL) in this period is expected to be around $242.57.
SOL coin price prediction signals a potential settling point of around $247.63 for the token during the year. These projections highlight the dynamic trajectory and potential value range for Solana during the year. (Source: Here)
Solana Price Prediction 2027
The prevailing sentiment within the crypto community, as evident in online discussions and social media activity, points towards a positive outlook for Solana in 2027.
Our SOL price prediction for the year indicates that Solana has the potential to attain a maximum price value of $419.08, illustrating the optimistic trajectory it may follow. Towards the end of 2027, our predictions suggest an average trading price for SOL at $374.10, with an anticipated minimum price of $364.20. These projections underline the positive sentiments and potential growth anticipated for Solana in the coming year. (Source: Here)
Solana Price Prediction 2028
Employing advanced technical analysis techniques, our Solana price prediction sees an optimistic outlook for Solana, suggesting a potential peak price of $636.61 by 2028. This positive trajectory is substantiated by our analysis, which anticipates an average price of around $548.92 for SOL.
It is essential to factor in a minimum projected price of $537.69, representing a conceivable lower limit for Solana’s value during this period. These analyses highlight the potential growth and variability in Solana’s pricing dynamics in the year 2028. (Source: Here)
Solana Price Prediction 2029
According to Solana coin price prediction for 2029, Solana is expected to reach a peak value of $921.06, primarily propelled by anticipated announcements of new partnerships and increased adoption by institutions.
The forecasted trading range for Solana (SOL) in 2029 indicates a projected minimum trading price of $752.78.
On average, SOL is anticipated to maintain a trading range of around $774.73, showcasing a moderate level of stability throughout the year. These projections underscore the potential for significant growth and stability for Solana in 2029, driven by strategic partnerships and institutional adoption. (Source: Here)
Solana Price Prediction 2030
Our Solana price prediction for 2030 suggests that under favorable market conditions, SOL could achieve an average price of around $1,136.64.
In a bullish market trend, the peak price for Solana in 2030 might surge to $1,297.74. Conversely, there exists the potential for the minimum price to decline to $1,105.65 for SOL, especially in situations where the market favors bearish conditions. These projections underscore the range of possibilities for Solana’s pricing dynamics in the year 2030, contingent on market trends and developments. (Source: Here)
Solana Price Prediction 2040
According to Solana coin price prediction 2040, the estimated price range is from $38,969.15 to $47,799.60, with the average trading price anticipated at $41,848.65. This comprehensive range reflects market expectations and factors in diverse scenarios such as the likely mainstream adoption of cryptocurrencies. (Source: Here)
With an envisaged widespread use of coins like Solana for everyday transactions by a substantial portion of the global population and broad acceptance by businesses as a payment method, the crypto market is poised to mature. This increased adoption and market maturity contribute to a more stable store of value, presenting an appealing prospect for long-term investments. The evolving landscape suggests a future where Solana becomes a prominent player in facilitating secure and widely accepted transactions.
Solana Price Prediction 2050
Per Solana price prediction 2050, the maximum trading price for Solana would be approximately $69,851.73, with our analysis indicating an average price of around $64,716.63 for the same period. While temporary downturns could occur, with the minimum price level hovering around $61,501.19, Solana is expected to face competition from other cryptocurrencies that offer distinct features and functionalities. (Source: Here)
As blockchain technology continues to expand, new currencies with enhanced capabilities may emerge. Despite this, Solana’s first-mover advantage, strong network effect, and established infrastructure are anticipated to contribute to its ability to maintain a dominant position in the cryptocurrency market.
It’s important to acknowledge that these predictions are subject to various factors, including market conditions, technological advancements, regulatory frameworks, and unforeseen events. Therefore, exercising caution and conducting thorough research is imperative when making decisions based on long-term price forecasts in the dynamic and evolving cryptocurrency market.
What is Solana (SOL)?
Solana (SOL) is a blockchain platform designed to host decentralized applications (DApps) that enable fast, secure, and scalable transactions. It was launched in March 2020, with its unique features distinguishing it in the blockchain space.
Key Features of Solana Include:
1. High Throughput: Solana is known for its high transaction throughput, capable of processing thousands of transactions per second. This is achieved through a combination of innovative consensus mechanisms and parallel processing.
2. Proof of History (PoH): Solana uses a unique consensus mechanism called Proof of History, which records the order and timestamp of transactions before they are added to the blockchain. This enhances the overall efficiency and speed of transaction confirmation.
3. Proof of Stake (PoS): In addition to PoH, Solana utilizes a Proof of Stake mechanism to secure its network. This involves validators staking SOL tokens to participate in the consensus process, adding an extra layer of security.
4. Scalability: Solana’s architecture is designed to scale horizontally, allowing for increased capacity as the network grows. Scalability is crucial for supporting a wide range of decentralized applications and a larger user base.
5. Native Cryptocurrency (SOL): SOL is the native cryptocurrency of the Solana blockchain. It is used for staking, transaction fees, and participating in governance.
Solana has gained popularity in the decentralized finance (DeFi) space due to its fast transaction speeds and relatively low fees. It continues to evolve, attracting developers and projects seeking a high-performance blockchain infrastructure.
Solana Price History
Source: coingecko.com
Historical Price Overview:
The Genesis of Solana
Solana’s inception dates back to March 2020 with the launch of its mainnet. Initially, SOL tokens were modestly priced, hovering around $0.50. The platform’s innovative approach to scalability and rapid transaction processing swiftly garnered attention in the blockchain sphere.
The Rise During the DeFi Wave
The pivotal moment for Solana came with the DeFi (decentralized finance) explosion in mid-2020. DeFi projects, in pursuit of swift and economical blockchain solutions, increasingly turned to Solana, known for its high transaction throughput and minimal fees. This growing reliance on Solana’s technology paralleled a notable rise in the value of SOL tokens. By August 2020, SOL had crossed the $3 threshold, indicating a significant appreciation in value. The trend persisted as an increasing number of DeFi projects and decentralized applications (dApps) adopted Solana.
The Bull Run of 2021
2021 marked a landmark year for Solana, coinciding with a bull run in the wider crypto market. SOL, which traded around $1 in early 2021, skyrocketed past $50 by May. This impressive surge in value can be attributed to several key factors:
Technological Prowess: Solana’s capacity to process thousands of transactions per second while keeping costs low attracted developers and investors alike.
DeFi Integration: The popularity of DeFi projects like Serum and Raydium, built on Solana, bolstered the demand for SOL tokens.
NFT Boom: The frenzy around NFTs (non-fungible tokens) also played a role in SOL’s ascent, as Solana became a go-to platform for NFT marketplaces.
Institutional Interest: Solana attracted interest from institutional investors looking for a high-performance blockchain platform.
Solana’s historical price movements reflect its journey from obscurity to prominence in the blockchain space. Its unique technological features, coupled with the rise of DeFi, NFTs, and institutional interest, propelled SOL to remarkable price levels.
Solana (SOL): Expert Predictions
Experts believe that Solana might experience a significant rally in the subsequent months, propelled by its growing ecosystem and DeFi integrations.
New DApps like ApeMax could potentially ignite interest in smart contract-based applications, increasing network activity on blockchains like Solana.
As we head into 2024, expectations abound regarding a potential surge in SOL’s valuation, especially with its promise of scalability and faster transaction speeds.
Looking further ahead, Solana price prediction 2025 anticipates that Solana (SOL) could potentially set new records, given its rising stature in the decentralized finance (DeFi) space.
Casting an eye towards 2030, Solana’s price prediction of 2030 varies greatly, with figures ranging from $100 to an ambitious $500. However, it’s important to take into account factors such as technological advancements and broader crypto market behavior.
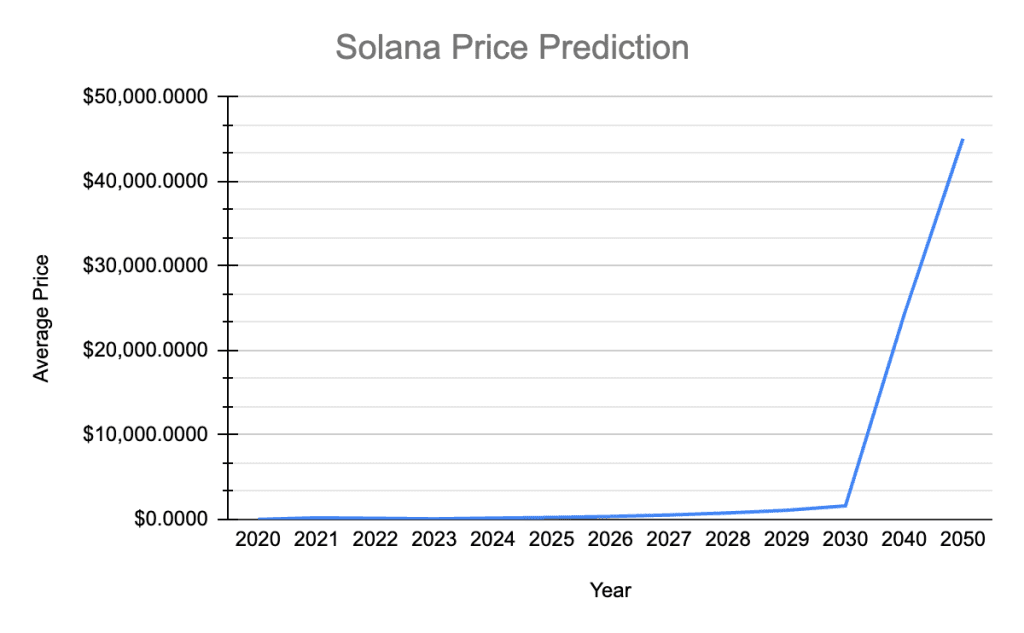
Solana (SOL) Price Prediction Table 2024 – 2050
| Year | Low Price | Average Price | High Price |
| 2024 | $161.15 | $165.85 | $201.35 |
| 2025 | $234.36 | $240.99 | $274.16 |
| 2026 | $349.74 | $356.96 | $392.25 |
| 2027 | $514.62 | $528.90 | $586.41 |
| 2028 | $747.29 | $768.44 | $875.13 |
| 2029 | $1,061.31 | $1,084.36 | $1,284.74 |
| 2030 | $1,562.99 | $1,606.36 | $1,879.52 |
| 2040 | $19,304.92 | $24,262.06 | $33,129.06 |
| 2050 | $41,158.23 | $45,068.09 | $54,982.37 |
There is optimism surrounding Solana, which projects a 5x return in over 7 years.
If the market momentum and investors’ sentiment positively elevate, then Solana (SOL) might hit $180. Furthermore, with future upgrades and advancements in the Solana ecosystem, SOL might surpass its current all-time high (ATH) of $260.06 and mark its new ATH.
SOL’s utility and real-world application suggest that the adoption levels should rise with the blockchain revolution. We suggest dollar cost averaging. It helps you accumulate the asset consistently without worrying about daily market rates. We recommend that you follow a systematic investment plan to start investing.
Sources:
https://cryptodisrupt.com/predictions/solana-price-prediction
https://changelly.com/blog/solana-price-prediction/
Disclaimer: Crypto products and NFTs are unregulated and can be highly risky. There may be no regulatory recourse for any loss from such transactions. The information provided in this post is based solely on the collation of publicly available information as of the date of publication of this blog and should not be considered investment/financial advice from CoinSwitch. Therefore, any action taken upon the information provided herein shall be at the user’s risk. CoinSwitch, including any affiliate entities, will not be liable for any losses incurred by the user because of the user’s reliance on the information provided above to execute any trades.