
If you are planning to trade in cryptos, familiarity with technical analysis tools and indicators is a must-have skill to achieve consistent results. Technical analysis primarily involves the study of price charts to identify a distinct price trend to execute trades better, unlike fundamental analysis, which tries to determine an asset’s real value. In other words, crypto technical analysis helps you to understand patterns and trends amid market chaos. This blog post will explain technical analysis in detail, the tools and indicators you need to follow, and their limitations.
Understanding crypto technical analysis
Technical analysis involves analyzing price charts using different mathematical indicators and statistical tools to predict the near-term price movement of an asset. Generally, in technical analysis, one does not pay attention to the fundamentals of the underlying crypto.
A technical analyst primarily relies on candlestick charts of multiple timeframes, volume, support and resistance levels, trendlines, and other indicators like MACD, RSI, Fibonacci Retracement, and Bollinger Band to identify patterns that indicate possible future price trends.
Technical analysis of price trends is a proven science based on the following assumptions:
Price discounts everything: Markets are very efficient in pricing assets, and the price of the underlying crypto factors in all significant developments. The price always reflects the actual value of the crypto based on market conditions and demand.
History repeats itself: Markets may appear complex, but price trends tend to repeat themselves. Essentially, investors are driven by emotions like fear and excitement, which are reflected in market movement. Technical analysis makes use of chart patterns to analyze this complex interplay between emotions and price movement to identify a trend.
Prices always follow a trend: Future price tends to follow an established pattern, which makes technical analysis effective in determining future price movement.
Technical analysis tools and indicators
Six commonly used technical analysis tools and indicators for analyzing crypto price charts are the following.
Candlestick charts
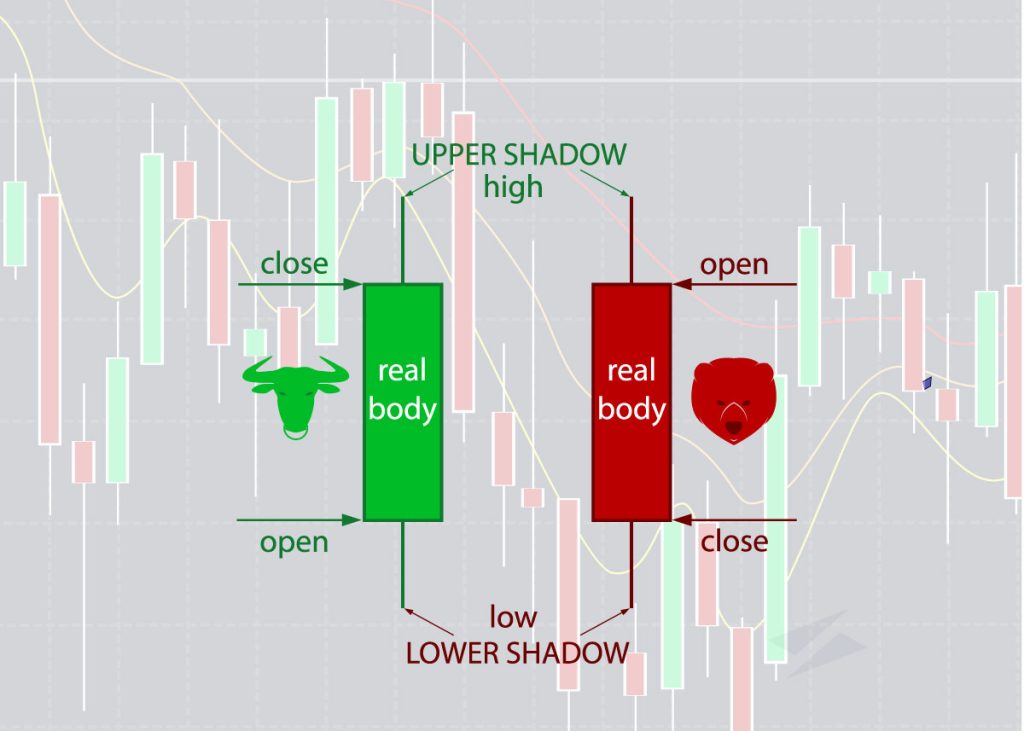
Traders prefer a candlestick chart to any other price chart (bars, line) because it has many useful features. It includes significant information about the future price direction due to its unique structure. Developed and mastered by Japanese rice traders around the 18th century, it is the oldest advanced price chart pattern currently in use.
A candlestick consists of a body and a wick (shadow). The body of the candlestick can either be green, which indicates an increase in price during the period specified, or red which shows a decline in price. The wick or the shadow in each candle suggests the highest and lowest price reached during the selected timeframe.
Support and resistance
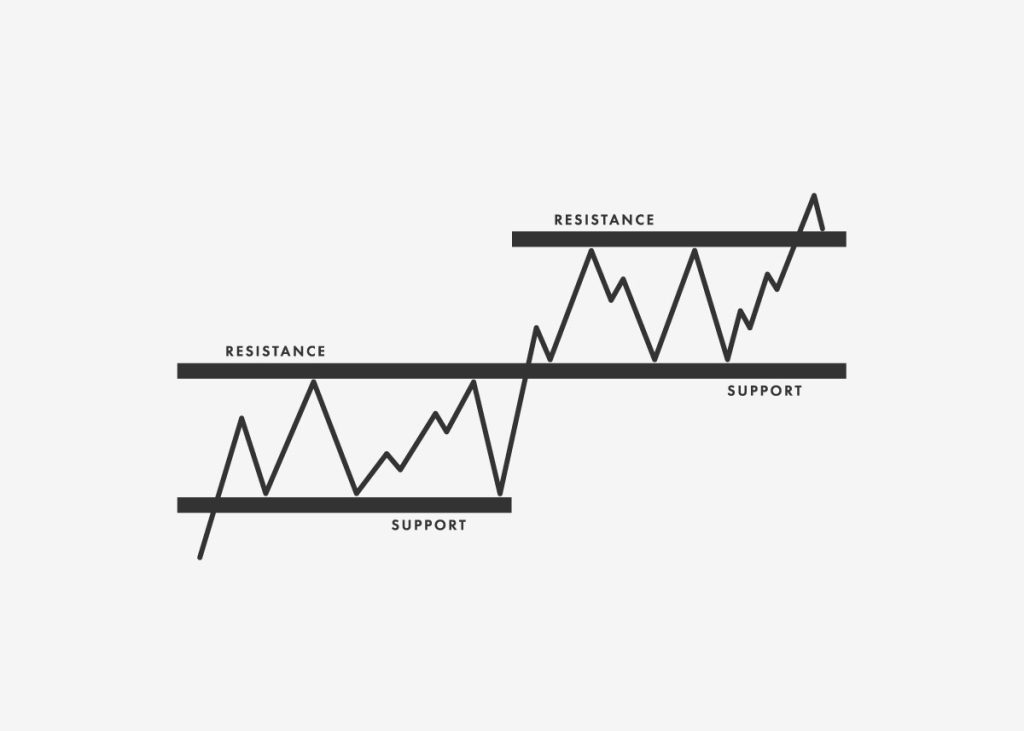
Support and resistance are two basic concepts in technical analysis. In fact, these parameters determine the further deployment of technical analysis tools and indicators. Every market has certain price levels which an asset finds it difficult to go above or fall below.
Resistance is the price level at which the asset finds it challenging to break above. If the asset has failed to cross that price level at least thrice in the past, it becomes a strong resistance level. Similarly, a support level is the price level where the price stops moving further lower and has a higher chance of bouncing back.
Trendline
A trendline is a popular form of technical analysis in crypto trading, but also the most underutilized. To draw a trendline, you need to draw the line correctly connecting two price points along the bottom of the support and resistance areas, or the valleys and peaks, as in the images shared below.
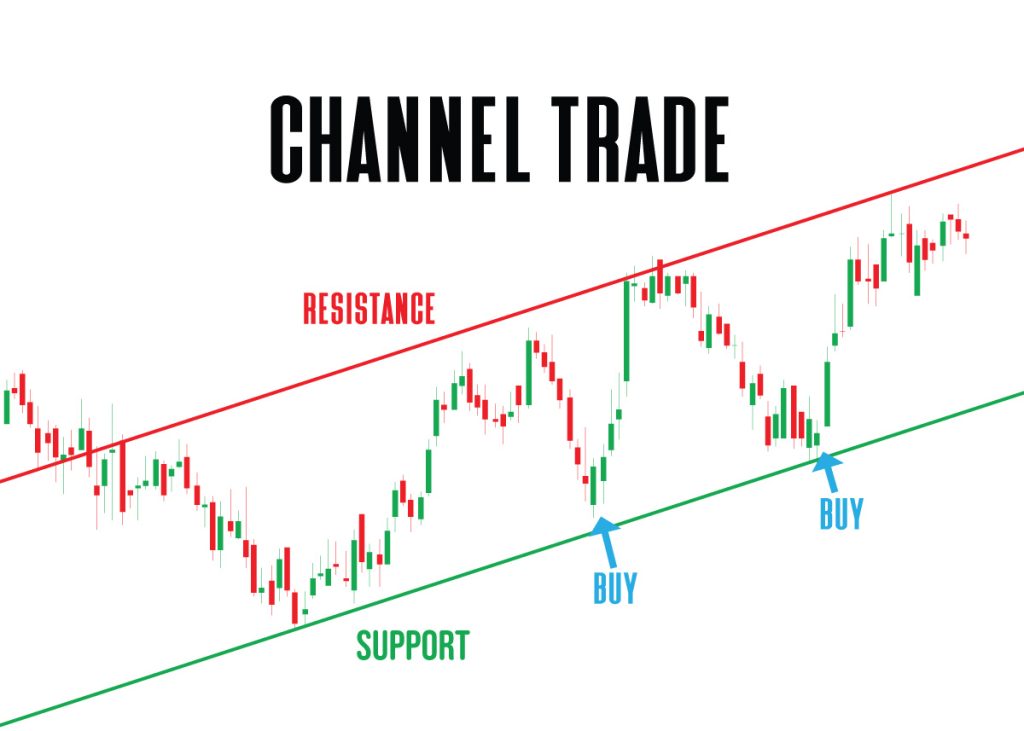
To draw a valid trendline, you should keep the following points in mind:
- A valid trendline should have at least two tops or bottoms, but it takes three to confirm the trendline
- Steeper trend lines are less reliable
- Horizontal (sideways) trendlines become stronger if you test them frequently
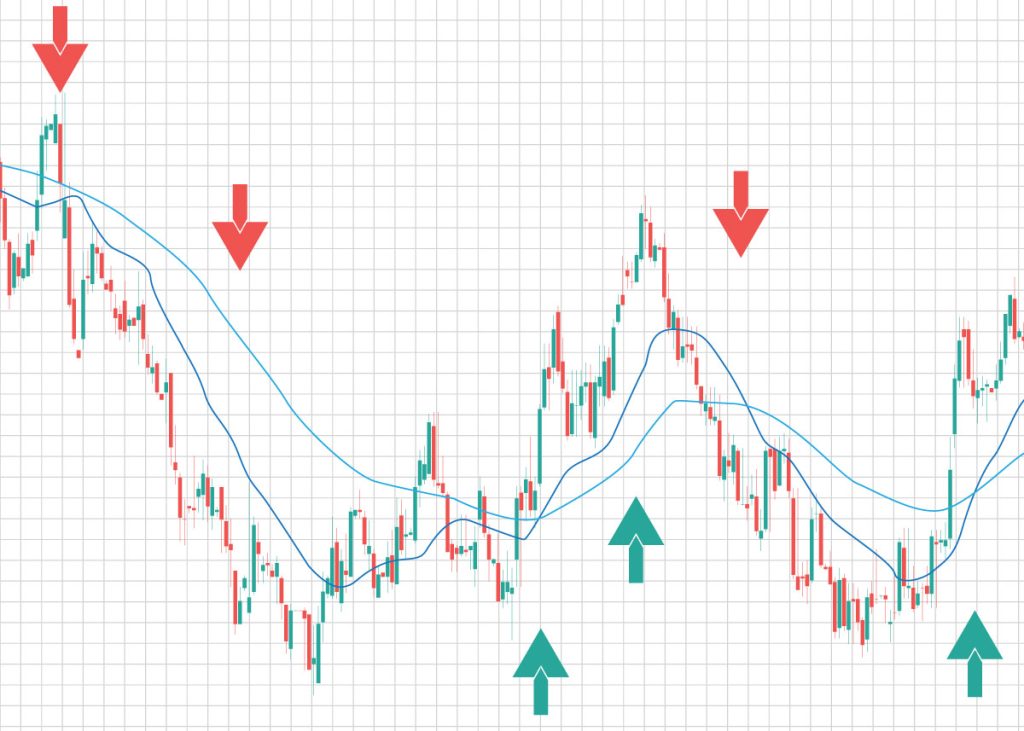
Moving averages
Moving averages are another popular technical analysis tool for traders. It provides information about the direction of a market trend. It helps to smoothen out price data by constantly updating the average price of the crypto.
The popular moving average timeframes are 20, 50, 100, and 200 moving averages (MA) to identify the support and resistance level. For short-term trades, a shorter DMA is effective compared to longer MAs.
There are two types of moving averages, simple moving averages (SMA) and exponential moving averages (EMA). You can calculate SMA by summing up all the closing price points in the chosen time frame and dividing the sum by the total number of days. EMA is the weighted average of the most recent price points of the selected time frame.
The primary difference between the two moving averages is the sensitivity. An EMA tends to show more sensitivity to the latest price changes and helps traders and investors gauge the trend better and more accurately.
Relative Strength Index (RSI)
RSI is a momentum oscillator that measures the momentum in the price change of an asset. The RSI oscillates between two extreme points, 0 and 100, where a score closer to 30 indicates an oversold condition and above 70 is considered overbought.
If the RSI line crosses 50, it indicates growing strength in uptrend momentum, but if it surpasses 70, it points to an overbought condition, and the asset’s price may fall. Likewise, if the RSI line dips below 50, it signals the start of a downtrend, and if it drops below 30, it indicates that the asset is oversold.
Essentially, when the security’s price makes an extended upmove and trades above its fair value, it is overbought.
Moving Average Convergence Divergence (MACD)
MACD is one of the key technical indicators traders follow due to its accuracy in depicting strength in price trends. It consists of two lines—the MACD line and the signal line.
To get the MACD line, 26 EMA (exponential moving average) is subtracted from 12 EMA, and the resultant value is plotted in the graph. And the signal line is the 9 EMA.
The MACD indicator is fairly easy to understand. When the MACD line crosses the signal from below, it is an indicator to buy as the momentum is strong. And when the MACD line crosses the signal line from above, it is a signal to start selling.
Limitations of crypto technical analysis
Despite its effectiveness in identifying future price trends using mathematical and statistical techniques, technical analysis has its limitations. Let us discuss some of these shortcomings.
Less accurate: Technical analysis helps us forecast future price movements based on established price trends and momentum. However, it doesn’t guarantee that the price of assets will move according to the analysis. There is always a chance that the market moves in the opposite direction to the established trend.
Mixed signals: Sometimes, two or more technical indicators can give mixed signals. One indicator might flash a buy signal, while the other shows a sell signal. The variance makes it difficult to make trading decisions. Therefore, a trader must cross-check and use multiple indicators and tools before making a trading decision.
Ignores fundamentals: Technical analysis doesn’t factor in significant market developments that can impact the price of crypto assets. The reason is that the analysis is based only on market data.
Conclusion
Crypto technical analysis is a skill that needs polishing. You require regular practice to understand how indicators move in different market conditions and accurately decipher the next price movement. Experienced traders don’t juggle multiple indicators, but use a few technical indicators and master them over the years.
FAQs
Which technical analysis is best for crypto?
Remember that no single indicator is foolproof, and successful crypto trading often involves a combination of these technical analysis tools along with fundamental analysis and risk management strategies. It’s essential to develop a well-rounded approach that suits your trading style and preferences.
Does technical analysis work on crypto?
Technical analysis is relevant and useful for trading cryptocurrencies. It provides valuable insights into market trends and helps traders make informed decisions in the volatile world of crypto (Number 1 and 2).
How does crypto analysis work?
Crypto analysis, whether technical or fundamental, aids investors and traders in making informed decisions in the volatile cryptocurrency market. By understanding these methods, individuals can better navigate the complexities of the digital asset landscape
How to learn crypto trading technical analysis?
Remember that technical analysis is just one aspect of crypto trading. It’s essential to combine it with fundamental analysis and risk management strategies for a well-rounded approach to trading.


