Analyzing price charts accurately is one of the keys to successful trading. But to learn how to do it, you will need top-of-the-line charting software. This kind of software, and the advanced charting tools that come with it, can help you track price action precisely and figure out what moves to make. One of the most popular software of this kind is TradingView. The TradingView charts are used by all classes of traders and investors, but especially professionals. If you want to join their ilk, this detailed guide should help you get started.
What does TradingView do?
TradingView charts are easy to access and browser-based. The charting platform assesses all assets, financial instruments, and cryptocurrencies traded globally. It tracks the price of all these assets and financial instruments on a real-time basis.
One of the best things about TradingView is the tool options it presents. The tools are free and accurate. They are available to and used by all levels of traders.
TradingView charts also come with a chat corner for users to socialize. Users can visit it to share trading ideas and discuss various trading-related developments.
For most traders, the TradingView charts are the go-to option. Nowadays, in fact, they are integrated with most investing platforms for quick access to price charts. This has made tracking the market and understanding price action much, much easier.
Features on TradingView
In the free version of TradingView, the following features are offered to users:
- Up to 12 TradingView chart types (including line, bar, candlestick, Renko, points and figure, and Kagi)
- Price action tracking in multiple time frames (from 1 minute to 1 month)
- Simultaneous use of up to 3 technical indicators from the 100+ pre-built ones listed
- Volume price indicator
- 50+ smart drawing tools
- Symbol comparison on the chart
- The option to create alerts on price, indicators, and trading strategies
- The option to create a watchlist of different stocks, cryptos, and assets
- Multiple interfaces such as Web, Android, and iOS
There are other, more advanced features, too, which can be unlocked with the paid version of TradingView charts.
TradingView chart analysis
There is no fixed method or guide that can help you analyze price charts. Everyone has or begins to have their own preferences when it comes to chart layouts, technical indicators, drawing tools, and so on. However, to start analyzing TradingView charts, you need to understand the basics of different technical indicators and learn how drawing tools are used.
Step 1: Start by selecting the right chart type and time frame
As a beginner, you can start with bars or candle chart patterns. They will help you get all the price action-related information you need. The line chart pattern won’t give you much information as the lines are drawn based on the closing price of the security or asset.
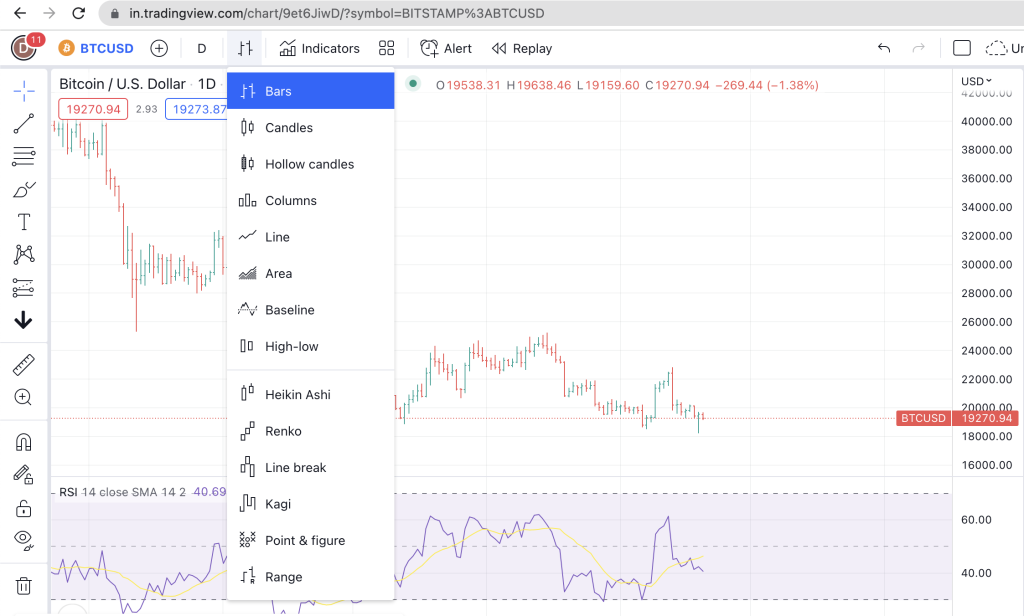
Screenshot of the TradingView interface for reference
The image above shows you where you can find a variety of chart patterns on the platform. You should choose one that is right for you after going through each option carefully.
Step 2: Factor in the time frame
Besides the chart selection option, you will need to select the time frame for the chart. If your investment duration is a few months or more, it’s better to select a longer time frame like the 1-day price chart. And, if you want to trade for a short period, anything from a 5-minute to 1-hour chart may be suitable. Similarly, if your trading span is a few days, the 4-hour chart can be selected.
Step 3: Draw the lines you need
The next thing to do is use smart drawing tools to draw key support and resistance lines and identify trend lines. (Learn how to do it here.) This will help understand price action in detail.
Step 4: Experiment with advanced drawing tools and technical indicators
Once you are comfortable with the basic tools of the platform, you can start using advanced drawing tools. Some options are Fibonacci Retracement, Gann Fan, and other geometrical shapes. Simultaneously, you can also start using the various technical indicators
How to use TradingView charts
For a better understanding of the price action, there are two ways to use TradingView charts. You could either try using it through your web browser or after installing the TradingView app on your smartphone.
While the app’s interface is quite simple, the web version of the platform gives you the best experience. That’s because users sometimes find it difficult to use multiple technical indicators while working on smaller screens.
On the web version, you will need to follow the steps below to access the live TradingView chart.
- Visit tradingview.com.
- Enter the symbol of the crypto or stock that you are looking for in the search bar.
- Select the option you were looking for in the list that pops up.
As soon as you complete the last step mentioned above, the TradingView chart will be launched instantly.
How to share TradingView charts
The TradingView platform gives you multiple options when it comes to sharing its price charts. To find them, go to the top-right corner of the website.
The first option is “publish.” Next to this button, there is a camera icon that will help you to save, copy, generate a link to the chart image, and tweet the price chart.
If you hit the publish button, you will find two self-explanatory options:
- Share the trading idea on the social chat window, and
- Record a video of the screen for sharing.
It’s as simple as that!
Pros and cons of TradingView charts
In a short period, TradingView charts have become very popular. The platform has in fact become a one-stop destination for all levels of traders and investors, but it is not without its limitations.
The pros
The popularity of Trading View has to do with the fact that the platform comes with so many pros. Read the list below for details
- Good design: TradingView has a simple and interactive user interface with great visual design.
- No add-on software necessary: The HTML5 charting solution ensures any device with an internet connection can access the platform through a web browser. There is no need to install any software, and the app of course is optional.
- Access to all asset types: The platform is a one-stop charting platform for price analysis of all stocks, cryptos, and other financial instruments.
- Precise and real-time updates of price charts: This is a big draw because it helps traders track the markets closely and accurately.
- Great tool options: TradingView offers an extensive collection of advanced technical indicators and smart drawing tools, and free members can access most of them, too. These tools are essential for traders and help them make informed trading decisions.
- Affordable plans: For professional traders interested in using some of the very advanced tools, the prices are kept affordable.
The cons
However, there are a few cons of the platform that you should be aware of as well. To name a few:
- Limited broker support: It’s difficult to use TradingView charts for trading if your broker has not integrated with the platform.
- Varying quality of the TradingView community: The unevenness of community quality is not very helpful for traders because of low engagement and the trading ideas and strategies being shared on the community page seeming random. The platform offers no rewards for loyal community members and that doesn’t help.
- Limited customer care: Only paying members can report any technical issues or contact the customer support
Wrap-up
TradingView has simplified chart analysis for millions of traders worldwide. One might even say that they have democratized the study of price charts. Earlier, studying such charts was a privilege reserved for the few that had the access to the right platform. Not so with TradingView charts on the scene.
Although the social side of the platform is not strong, the features and range of technical indicators that are offered make it the go-to platform of the trading community. Even with new asset classes like crypto, TradingView charts continue to remain a reliable option.
Now that you know all the basics, ready to get started on your technical analysis journey with TradingView?
FAQs
Is TradingView good for beginners?
Yes, TradingView is suitable for beginners. It offers user-friendly charting tools, educational resources, and a supportive community, making it a valuable platform for those new to trading and technical analysis.
Which TradingView plan is best for beginners?
For beginners, TradingView’s free plan offers essential charting tools and access to a supportive community. It’s a suitable starting point. Advanced features are available in paid plans.
Can I earn money from TradingView?
TradingView primarily offers charting and analysis tools. While it doesn’t directly facilitate earning money, traders and investors use its insights to make informed decisions that may lead to profits in financial markets.
Is TradingView free in India?
TradingView offers a free plan, but it also has premium plans with additional features. Users in India can access both free and paid plans, with a 30-day free trial available for the premium plans.


