Walk into any stock market, crypto exchange, or even a commodities pit, and you’ll notice the screens flashing prices in real time. But those numbers don’t just appear out of thin air. Behind the curtain sits the engine that makes everything possible, the order book.
Most traders see candles rising and falling on charts. What they don’t see is the constant back-and-forth tug of war happening underneath. Every second, buyers throw in their bids, sellers pitch their asks, and the order book records it all, line by line, without missing a beat.
Imagine it as a digital chalkboard that never sleeps. On one side, buyers shout what they’re willing to pay. On the other hand, sellers counter with what they want. The market listens, compares, and strikes a deal when the two sides overlap. Sounds simple, but in reality, it’s a window into human psychology, greed, fear, patience, and urgency, all displayed in raw numbers.
That’s why in this blog post, we’re diving deep. You’ll see what an order book really is, how it operates, the moving parts that bring it alive, and why traders, from small retail players to billion-dollar funds, study it closely. This will help you read an order book like a pro and recognize the signals that are often hidden in plain sight.
What Is an Order Book?
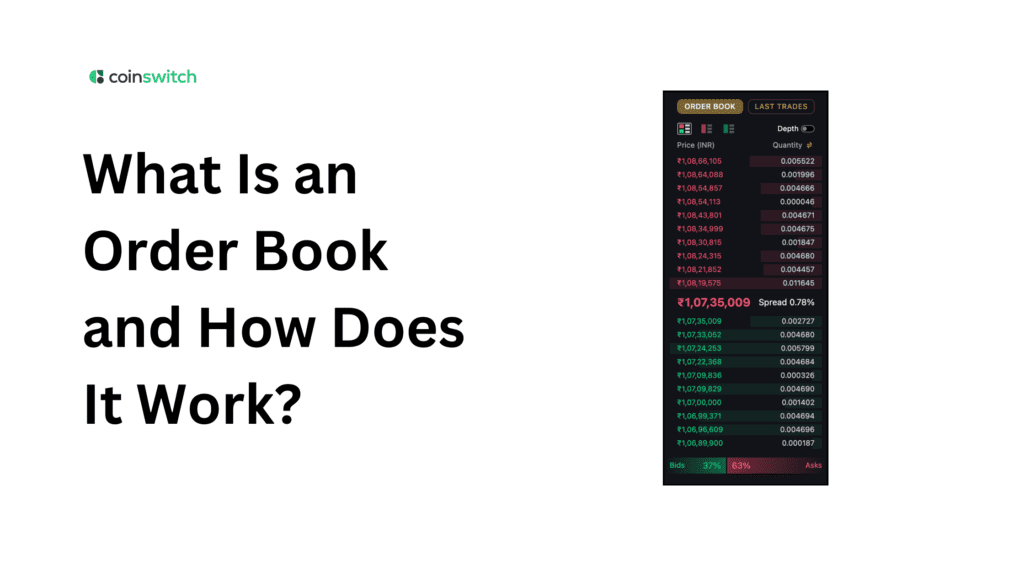
Strip away the jargon, and an order book is essentially a real-time list. It’s a running log of every buy and sell order for a specific asset, constantly refreshing, constantly shifting. Think of it as a marketplace ledger where every bidder and every seller leaves their number on the table.
Say you’re looking at Reliance Industries on the NSE. The order book shows you, in black and white, how many buyers are lined up, what price they’re willing to pay, and how many sellers are offering shares at different levels. At the top of the buy side sits the highest bid; that’s the most aggressive buyer in the room. On the flip side, at the very top of the sell side sits the lowest ask, the seller who’s ready to let go first. When those two numbers converge, a trade gets executed.
Crypto exchanges work the same way. An order book is a list of current buy and sell orders for an asset, showing price and quantities at each price. In other words, it is the real-time “map” of the market’s supply and demand.
An order book is dynamic and electronic. It updates constantly as new orders enter, old ones are canceled, and trades are executed. It’s not just a record, it’s the pulse of the market.
Read More: How to set stop-loss and take-profit orders
How Order Books Work?
So how does this ledger actually function?
When you place an order on an exchange, say, to buy 10 shares of Infosys at ₹1,600, the system doesn’t just toss it into the void. It goes straight into the order book under the “bids” section. Your order will sit there until either:
- A seller agrees to your price,
- You cancel the order, or
- Market conditions move past your order without filling it.
The same thing happens on the other side. A seller puts up 50 shares at ₹1,605, and that sits in the “asks” section.
The matching engine of the exchange constantly scans the book to pair the highest bid with the lowest ask. When the two align, a trade is executed, the order is removed, and the book updates instantly.
This backend scene happens thousands of times a second in liquid markets. To the outsider, it looks like a constantly changing price ticker. But under the hood, it’s just the order book doing its job, matching buyers with sellers.
Key Components of an Order Book
Every order book has a few standard elements. Once you learn them, interpreting them becomes second nature.
Bids (Buy Orders)
This section lists all the prices buyers are offering. They’re usually arranged from highest to lowest. The top bid is important; it shows the strongest buying interest at that moment.
Asks (Sell Orders)
This is the mirror side. It lists prices sellers are asking, arranged from lowest to highest. The lowest ask is the price at which someone is currently willing to sell.
Bid-Ask Spread
The small (sometimes not so small) gap between the top bid and the lowest ask is called the spread. A tight spread usually signals a liquid, active market. A wide spread often means lower liquidity or higher uncertainty.
Order Size (Volume)
Alongside each price, the order book indicates the number of shares or tokens available at that level. A big cluster of buy orders at one price is called a support level; a wall of sell orders often acts as resistance.
Market Depth
This refers to the amount of buy and sell volume that exists across different price levels. A deep order book with lots of stacked orders means the market can handle big trades without much slippage. A shallow book, on the other hand, reacts sharply to large orders.
These components together tell the story of market supply and demand in real time.
Read More: What are the different order types, and how to place them
Visualizing Order Books: Depth Charts
Looking at a raw order book, just rows of numbers, can feel overwhelming. That’s where depth charts come in.
A depth chart takes all the bids and asks from the book and plots them visually. On one side, you see a curve representing cumulative buy orders. On the other hand, a curve for cumulative sell orders. The point where they meet marks the current market price.
Why does this matter? Because depth charts instantly show where liquidity pools exist. If you see a big wall of buy orders at a certain price, you know traders expect strong support there. If there’s a massive cluster of sell orders stacked above the current price, that might be a ceiling the asset struggles to break.
For day traders, watching depth charts is like watching waves. You can spot momentum, anticipate reversals, and decide where to place orders more strategically.
How Traders Use Order Books
Order books aren’t just background noise; they’re tools traders use to read the market’s mood.
Scalpers check order flow to spot short-term momentum. For example, if they see a surge of buy orders flooding the top of the book, they might ride the wave for a quick profit.
Swing traders use the book to confirm support and resistance. A thick wall of sell orders at ₹1,650 may suggest resistance. If that wall gets eaten away by buyers, it signals strength.
Institutional traders often watch for hidden liquidity. Sometimes, big players split their orders into smaller chunks to avoid detection. Watching how the order book refreshes at key levels can reveal their presence.
Even long-term investors use order books. If they’re entering a big position, they’ll check the depth to avoid moving the market too much.
Simply put, order books are the closest thing to seeing raw supply and demand before trades hit the chart.
Types of Orders in an Order Book
Every entry in the order book comes from a specific type of order placed by a trader.
Market Orders
These orders say, “I want to buy or sell immediately at the best available price.” Market orders get filled instantly by consuming liquidity from the book.
Limit Orders
These are patient orders. A buyer sets a maximum price they’re willing to pay; a seller sets a minimum they’ll accept. Limit orders create the structure of the order book itself.
Stop Orders
These trigger once a certain price is reached. A stop-loss order, for example, might activate a market sell if prices fall below ₹1,500. Stops don’t sit in the book until triggered, but once active, they affect the flow.
Iceberg Orders
Large institutional players sometimes use iceberg orders. They place a massive order, but only show a small piece in the book. As one piece fills, another appears. This conceals the true extent of their trade from public view.
Understanding these order types makes it easier to read why certain price levels look heavy with orders and how the market might react.
Conclusion
The order book may look like rows of dry numbers, but in reality, it’s the beating heart of every exchange. It captures buyer ambition, seller patience, market psychology, and trading momentum all in one snapshot.
By now, you’ve seen what it is, how it works, its key components, how depth charts help visualize it, and the ways traders use it to their advantage. You’ve also walked through the different types of orders that populate the book and learned why each matters.
Whether you’re trading stocks, crypto, or commodities, the order book is your window into supply and demand. Learn to read it, and you’re not just watching the price; you’re watching the forces that move it in real time.
So, the next time you open a trading platform and see that panel of bids and asks, don’t scroll past it. That’s where the market lives.
FAQs
1. How does an order book work in crypto?
In crypto, the order book is a live list of buy and sell offers. Buyers post bids, sellers post asks, and when the numbers meet, a trade fires instantly. It updates nonstop, which is why crypto feels like a market that never sleeps.
2. What do you mean by order book?
An order book is the marketplace ledger. It records who wants to buy, who wants to sell, and at what price. It’s the clearest window into supply and demand you’ll find.
3. What are the different types of order bookings?
The book holds market orders (fill now), limit orders (set price), stop orders (trigger later), and even iceberg orders where big players hide the overall size of the order. Together, they shape the rhythm of trading.


