Crypto trading is a fast-paced world with phases of extreme volatility punctuated by extended periods of bull runs and spiraling slumps. The volatile nature of crypto makes it ideal for trading opportunities. Seasoned crypto traders use technical indicators such as Bollinger Bands, Moving Averages, and RSI to decipher market trends.
Bollinger Bands indicator is a technical analysis tool that uses price volatility to provide probable entry and exit opportunities to crypto traders. Read on to learn more about how to use Bollinger Bands in trading.
What are Bollinger Bands (BB)?
John Bollinger created Bollinger Bands, a frequently used technical analysis tool, in the 1980s.
They are used to trade crypto and other financial assets to evaluate price volatility, ascertain price reversal points, and identify probable entry and exit points to make trading decisions.
The Bollinger Band indicator consists of three bands. Here is the significance of each band.
Middle band
The middle band is the simple moving average (SMA) of the asset price for N periods. Generally, an SMA for 20 days is preferred. The middle line serves as the baseline indicator and helps traders identify the asset’s trend direction.
Upper band
The upper band is calculated by adding two standard deviations to the middle band’s value. The upper band represents the asset’s expected price range and is considered the resistance level for the asset.
Lower band
The lower band is calculated by substarting two standard deviations from the middle band’s value. The lower band represents the lower limit of the assets’ price movements. The lower price limit is popularly known as the support price.
The Bollinger band indicator on the trading chart will look something like the picture attached below:
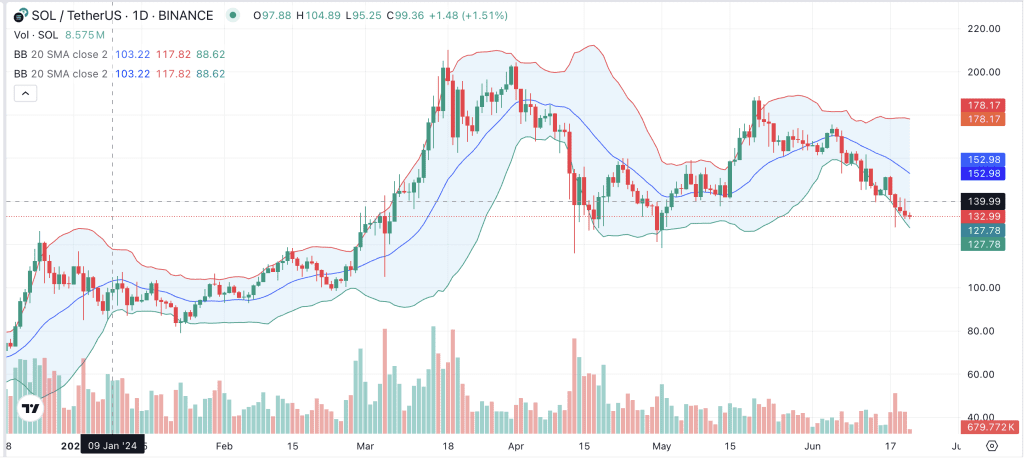
Here you can see that the SOL price rebounded after touching the lower band and the price saw a correction once it touched the upper band.
Moreover, a crypto asset is deemed to be in the overbought territory when the price touches the upper band, signaling a potential selling opportunity. On the other hand, a token will be considered oversold when the price touches the lower band, indicating a buying opportunity.
Typically, the widening of bands signals high volatility, while contracting bands signal low volatility. While Bollinger Bands are widely used, they should be read in conjunction with other technical indicators to confirm trends.
Bollinger Bands for setting entry and exit points in crypto trades
BB indicators are used to identify trade entry and exit points for various trading strategies such as swing trading, scalping, etc. Even medium and long-term investors in crypto use Bollinger Bands to identify the entry and exit points. Here is how Bollinger Bands can be used in crypto trading and investment:
- Entry points
A common trading strategy when using the BB is identifying the overbought or oversold conditions in the market.
The lower band on the BB indicator signifies the support price levels. Therefore, when the price touches or breaks the lower band, traders interpret this as the crypto being in the oversold category, indicating a buy signal.
- Exit points
Traders can also use Bollinger Bands to time their exits. The upper band indicates the resistance level and therefore, a trader might book profits when the price touches or breaches the upper price band. A trader who is short on the crypto will close out the position when the price approaches the lower band.
However, combining the Bollinger Band indicator with other technical indicators is important to make more dependable trades.
How to use Bollinger Bands indicators to trade cryptos effectively
Effective use of Bollinger Bands can provide useful insights such as crypto’s support and resistance levels. Additionally, the band distance also indicates the volatility trend for the token. Contracting bands signal reduced volatility whereas widening bands signal heightened volatility in the market. Reading and interpreting the Bollinger Band indicator accurately can help traders make better trading decisions. Here is how you can harness the power of Bollinger Bands to maximize your trading strategies:
1. Identifying volatility and price range
Crypto traders can identify the expected price range by studying the distance between the upper and lower bands. This is because wider bands suggest increasing volatility and contracting bands suggest reduced volatility.
2. Spotting overbought and oversold conditions
Bollinger Bands help identify the overbought and oversold conditions in the market. When the price is tough or breaches the upper band, the asset may be overbought, suggesting a price reversal due to selling pressure. Conversely, price touching or moving below the lower band points to probably oversold condition, signaling a potential buying opportunity.
3. Bollinger Bounce strategy
Traders use this strategy to benefit from the price reversals by reading the bands. The buying opportunity is when the price bounces off the lower band, while the price bounces off the upper band when the position is closed.
4. Bollinger Squeeze strategy
While using the Bollinger Squeeze strategy, traders identify periods of low volatility by studying the narrowing bands. The trades are placed to benefit from the breakout patterns from the impending volatility.
However, Bollinger Bands are not foolproof and come with risks like other trading indicators. A comprehensive understanding of the Bollinger Band indicator in correlation with other indicators can help traders place trades designed to maximize profits while minimizing losses. Here is how Bollinger Bands can be combined with other indicators for a clearer market view.
Combining Bollinger Bands with other trading indicators
Crypto traders prefer using multiple technical indicators before deciding on their trading strategies. We have listed a few combinations of Bollinger Bands and other tools that could be useful in trading.
Bollinger Bands and RSI
Trading gains are usually a function of volatility. Combining Bollinger Bands with the relative strength index (RSI) reading can help traders spot possible trend reversals. The price bouncing off the upper price band and the RSI indicating an overbought situation usually signal a probable slump in the market.
Volume analysis
Trading volume analysis read with the Bollinger Band indicator can help traders confirm price fluctuations. The increased trading volume during a Bollinger Band breakout can strengthen the band’s signal validity.
Bollinger Bands and moving averages
Bollinger Bands teamed with moving averages add more context to the trend analysis. One such instance is the Bollinger Bands and moving averages crossover approach which can support the confirmation of trend change.
Bollinger Bands used with one or more other technical indicators can help traders confirm their findings and help them trade confidently. Besides, traders can use proper risk management techniques to safeguard their positions from extreme price volatility due to black swan events.
Limitations of Bollinger Bands
Despite its usefulness, Bollinger Bands come with their share of downsides. Here are some limitations of Bollinger Bands.
- Whipsaw effect
Bollinger Bands can produce incorrect signals during extremely volatile or sideways market conditions. During such times, prices can cross the bands multiple times, leading to whipsaw-like movements that confuse traders.
- Not standalone Indicators
As stated above, Bollinger Bands should not be used in isolation. They are best used in conjunction with another indicator to confirm your findings.
- Assumption of volatility
Bollinger Bands work on the premise that price fluctuations follow a normal distribution. This is their biggest limitation as price fluctuations can deviate significantly from the normal distribution or the bell-shaped curve during phases of high volatility. This reduces the utility of the Bollinger Bands indicator during periods of heightened volatility.
- Lagging indicator
Bollinger Bands rely on historical price data, making it a lag indicator. They often fail to provide timely signals during a choppy market. Hence, experts recommend using Bollinger Bands with other indicators.
Conclusion
Crypto trading is risky and technical tools can help traders reduce risks. Technical indicators such as Bollinger Bands are valuable for crypto traders in designing strategies for a particular market phase.


