Chart pattern cheat sheets are valuable tools for investors and traders, providing quick access to common chart patterns employed in technical analysis. These guides help identify trends, reversals, and trading opportunities in fast-paced markets. With limited time and data, traders often rely on cheat sheets to make faster and more informed decisions. They simplify complex research and enhance understanding of price movements. Let’s explore what a chart patterns cheat sheet is and how to use it effectively.
What Is a Chart Pattern?
By illustrating how the market perceives prices, chart patterns enable traders to understand how prices move. They form automatically at key levels where many players exhibit similar behavior. These responses establish expected patterns that indicate breaks or potential changes in the trend. After breaks or during the formation of higher lows, patterns often emerge that indicate changes in the market’s direction.
What Is a Chart Patterns Cheat Sheet?
You can use a chart patterns cheat sheet guide to quickly look up essential trade patterns like triangles, flags, and head and shoulders. It provides buyers with a quick way to view price trends, reversals, and periods of consolidation. By condensing important information, these sheets facilitate technical analysis. They are invaluable for individuals just starting, and traders often use them to make faster decisions during live trades.
Major Chart Pattern Types
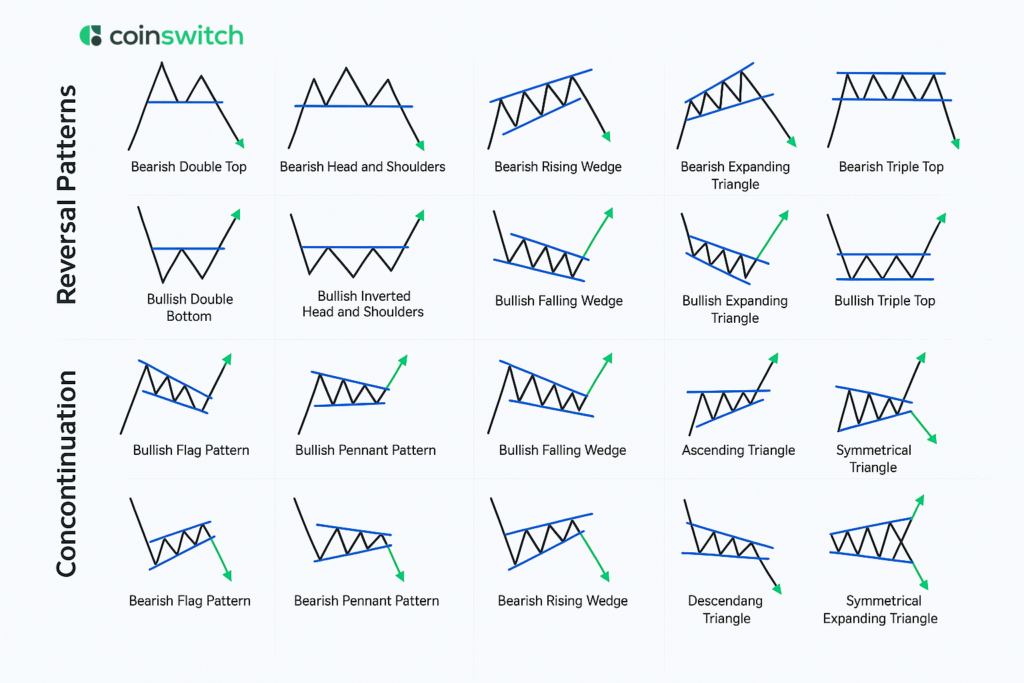
The chart patterns cheat sheet can be classified into three main groups. Take a look at this list.
1. Bilateral
When neither buyers nor sellers can gain an advantage, the market exhibits a mutual trend. Depending on the pattern that forms, the current trend may continue or change direction. Here are some examples of bilateral patterns:
· Symmetrical Triangle: This two-sided pattern can be observed on a chart when prices are moving within a range, forming a triangle shape with lower highs and higher lows. This neutral chart pattern doesn’t point in any one direction, so it could lead to either a bullish or bearish exit.
· Rectangle: When the price moves between two horizontal lines, this pattern shows up. It’s possible to push against the top line and pull against the bottom line. Either a bullish or a bearish breakout is possible with this pattern.
2. Continuation
A continuation chart pattern cheat sheet indicates that the price will remain stable for a while before resuming its upward trend. The trend that was there before is likely to stay even after the pattern is over. Here are some examples:
· Flags and Pennants: Typically, these positive patterns emerge following a sharp price move that then remains within a tight range. Flag designs are generally square, while pennants are more triangular. Most of the time, these continuation chart patterns are viewed as signs of a sustained rise. They show that the period of consolidation is merely a brief pause before the trend resumes.
· Ascending and Descending Triangles: When the price moves within a band with a string of higher lows or lower highs, these patterns emerge. A declining triangle has a flat bottom and a top trend line that goes down. An ascending triangle has a flat top and a bottom trend line that goes up. Most people believe that these rising chart patterns indicate that prices will continue to rise.
3. Reversal
You can use reversal patterns to identify potential shifts in market trend direction. Reversal patterns generally indicate that a trend is nearing its end; they can also suggest that the price of an asset is about to change. Here are some examples of reverse patterns:
· Head and Shoulders: When the price reaches a peak, it is then topped by a higher peak and subsequently falls back to a lower peak; this pattern is known as a head and shoulders. This is a negative reverse pattern.
· Double Top and Bottom: If the price rises to a high level, then falls, and then returns to a similar high or low, this pattern is formed. A negative turnaround happens when this pattern appears at the end of a rise. A positive turnaround occurs at the end of a decline.
Read More:
How Do You Use a Chart Pattern Cheat Sheet?
To use a chart patterns cheat sheet correctly, you need to do more than just recognize the patterns on it. Traders must consider trends within the broader context of how the market operates. Over time, an organized method leads to more accurate research and better decisions.
· Use the Chart to Find the Pattern
Chart patterns can help you figure out what’s happening in the market at any given time, or you can pick out a few trade patterns to keep a watch on. In either case, the chart patterns cheat sheet will make it easy for you to see which way the trend is going.
· Practice Is Key
Carefully review the cheat sheet and remember the key patterns along with their corresponding visual representations. Get better at finding these patterns on both past and real-time charts. This boosts trust and makes it easier to spot patterns. Free tools can aid in real-time study and practice.
Variations Awareness
Patterns may not always appear as they do on the cheat sheet. It’s normal for things to be slightly different, so don’t ignore them. Focus on understanding the basic organization and how the chart behaves. When you know about these differences, you can read market signs more fluidly and accurately.
· Frequency Is Important
Find out how often specific themes show up in every market and every period. In risky assets, specific patterns occur frequently, while others are less common. How often you should trade based on a trend depends on how it usually happens. When you understand this, you can adjust your trading approach to suit different situations.
· Find Possible Entry or Exit Points
To get the most out of chart trends, you need to know when to make trades. For instance, the optimal time to initiate a long position when spotting a bullish flag continuation pattern would be when the price breaks above the top horizontal trend line. The starting point for a bearish reversal pattern, such as the evening star, will be different. Typically, it occurs near the end of the third wave.
Read More: What is Kubernetes and How Does It Link to Crypto?
Tips on How to Effectively Use a Free Chart Patterns Cheat Sheet
Using a chart patterns cheat sheet can improve your approach to trading. The key is to focus on trends that have been proven to be effective. Here are some patterns that every trader should know how to use:
· Head and Shoulders
This well-known pattern indicates that a trend may shift from rising to falling. It has three peaks, with the tallest being in the middle (the head) and two smaller ones on either side (the shoulders). The pattern has a very high success rate, making it one of the most reliable in technical analysis.
· Triangles: Ascending, Descending, Symmetrical
Triangles are continuation patterns, which means that the current trend is likely to continue. They appear when prices remain constant, creating trend lines that become thinner. This indicates that the market is uncertain about its next move. Triangle patterns are a crucial part of any technical trader’s cheat sheet because, once a breakout occurs, it typically confirms the direction of the trend.
· Double Top and Double Bottom
These patterns are very effective at indicating when a trend is about to shift. A double top suggests a shift from bullish to bearish sentiment. A double bottom shows a change from bearish to bullish. They have a clear structure, they are easy to spot, and they are invaluable for traders who use fundamental analysis.
Conclusion
The chart patterns cheat sheet is a vital tool for traders and researchers operating in the fast-paced world of financial markets. An essential tool for market players of all skill levels, this blog post simplifies the complex world of chart patterns in a clear and approachable manner.
FAQs
1. What is a chart pattern cheat sheet?
A chart pattern cheat sheet is helpful for traders and those who perform technical analysis, as it lists various chart patterns. Pattern names, pictures of what the patterns look like, and sometimes a short explanation of what the patterns are and what they might lead to are usually in this list.
2. What are charting patterns?
A chart pattern is a recurring set of price changes. Chart pattern analysis is based on the idea that you can guess what might happen when a pattern shows up again if you know what happened after it in the past.
3. What is the 1/2/3 trading method?
Price action trade patterns, such as the 1-2-3 method, are used to identify potential trend changes or continuations. Three key price points form a distinct pattern on a price chart. It has three parts: a swing high or low, a return in the opposite direction, and a swing high or low in the direction it came from. This proves the change.


