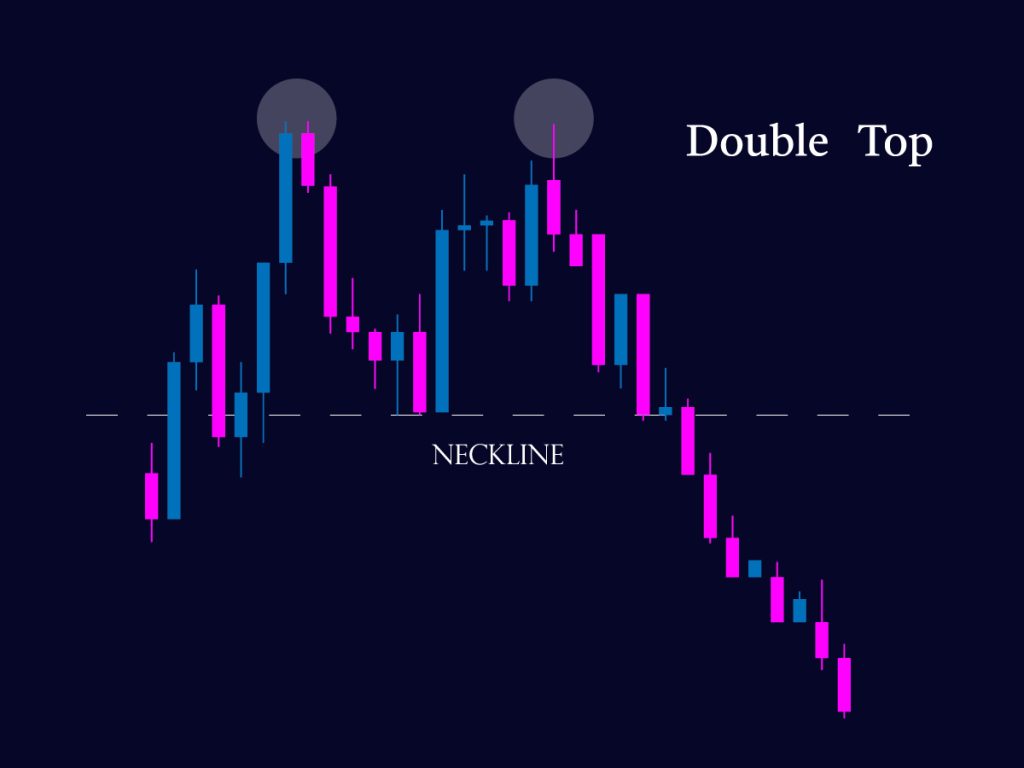
The cryptocurrency market is a very volatile space where the prices of cryptos fluctuate. While it is difficult to gauge the exact price trends of digital assets, there are tools to help investors navigate the twists and turns of the market. Technical analysis is a trading method that involves monitoring price movements and trading volume of cryptos to predict future price movements. One such market chart is the head and shoulders pattern, a tool used for technical analysis in crypto.
The head and shoulders pattern is a reliable guide for crypto investors. However, learning to decipher these patterns is important. This blog post will discuss everything about head and shoulders patterns in crypto.
What is a head and shoulders pattern?
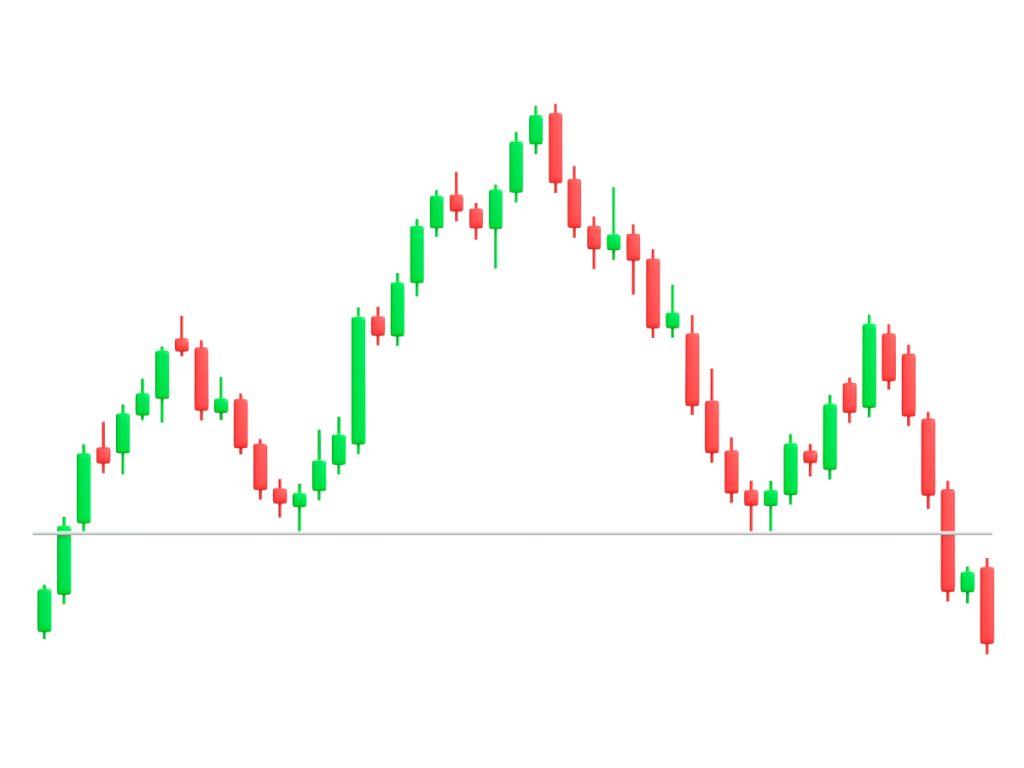
The head and shoulders pattern is a market chart that crypto traders use to identify price reversals. The head and shoulders pattern is exactly what the term indicates. It resembles a baseline with three peaks with the middle topping the other two. The pattern resembles a left shoulder, head, and right shoulder, hence the term head and shoulders. This pattern on a chart mostly indicates the reversal of an upward trend. Seasoned investors would know that in crypto, upward trends are known to turn sour.
So, if you see this pattern in crypto it means only one thing—the bullish trend is ending and a bearish trend will likely take over.

How to identify a head and shoulders pattern?
A head and shoulders pattern is easy to identify. All you have to do is look at the chart reading above and search for a pattern that resembles it. Historical price patterns of crypto indicate that a head and shoulders pattern typically occurs after a prolonged uptrend. If a crypto asset has been trading in the green for a long time, it points to an impending potential reversal in the price trend. The head and shoulders formation consists of three major elements:
- Head: The highest point in the head and shoulders formation.
- Shoulders: Shoulders represent the two peaks known as the left and right shoulders. While the shoulders are mostly symmetrical, asymmetrical shoulders are also accepted if there is no significant difference.
- Neckline: Neckline is the line that connects both the shoulders. It is the most important feature of the pattern as a move above or beyond this line could break the pattern formation. The neckline need not necessarily be a straight line.

What is an inverse head and shoulders pattern?
Put simply, an inverse head and shoulders pattern is the opposite of the traditional head and shoulders pattern that signals a potential trend reversal from downtrend to uptrend. It is also called a head and shoulders bottom, as the pattern formation is the opposite of a regular head and shoulders chart. Much like the head and shoulders pattern, the inverse head and shoulder formation consists of three mandatory elements:
- Head: The lowest point in the inverse head and shoulder formation.
- Shoulders: The two lows on the side of the head represent the shoulders. They are shorter than the head.
- Neckline: A neckline connects the highs of the two shoulders.
Crypto investors view the inverse head and shoulders pattern as a bullish signal. Even if the digital asset’s price creates a low initially, the inverse pattern indicates a move from a downtrend to an uptrend.
Advantages of head and shoulders chart pattern
The head and shoulders chart patterns offer several advantages to crypto traders, which include:
- Easy-to-read chart: The head and shoulders pattern chart is an easy-to-read chart even for novice traders. Traders only need to look closely at the price history chart and identify the pattern that looks like a head with two shoulders.
- Reliability: In crypto, the head and shoulders chart pattern is one of the most reliable indicators to predict price reversals. Crypto traders can use this information to prepare themselves better.
- Easy to identify: Traders of all levels can easily recognize the pattern to identify potential trend reversals.
- Risk management: Finding the right balance between risk management and optimizing return is difficult in crypto investment. By using the neckline as a reference point for entry and exit points, traders can effectively manage risk while ensuring maximum returns.
- Long timeframe: The time frame of the head and shoulders pattern is fairly long, so investors don’t have to make any hasty decisions or be swayed by FOMO. They can do thorough research before investing.
Challenges of head and shoulders chart pattern
Despite the popularity of the head and shoulders chart pattern among crypto investors, the chart pattern comes with its share of challenges.
- Subjective interpretation: While the head and shoulders pattern is largely reliable, the interpretation of the chart might differ among traders. This might lead to a lack of clarity and inconsistency among novice traders.
- False signal: The head and shoulders pattern chart might not always signal a trend reversal. Traders could suffer major losses if they rely solely on the pattern to make trading decisions.
- Market influence: The crypto market is extremely volatile and as history has shown, market dynamics may influence the head and shoulders patterns, rendering it unreliable in some cases.
- Dependency on other indicators: The head and shoulders pattern depends on other indicators like the Relative Strength Index (RSI) and Moving average convergence/divergence (MACD), which may sometimes overlap, resulting in conflicting signals.
- Difficult to spot for novice traders: New traders might overlook the pattern as the neckline is not always a perfectly flat line but could be tilted too, which can be misleading for inexperienced traders.
Does the head and shoulders pattern indicate bullish or bearish sentiment?
The head and shoulders pattern indicates a bearish trend. However, the inverse head and shoulder signals a bullish trend. Crypto traders interpret the head and shoulders formation as a clear indication of a bullish trend reversing to a bearish one.
Conclusion
The head and shoulders pattern is a reliable technical indicator for crypto investors. Investors, both novice and experienced, follow it closely. With technical indicators like the head and shoulders pattern, investors can navigate the complex crypto market efficiently. However, the head and shoulders chart pattern is just a tool that can amplify trading decisions and garner potential gains, but it is not a surefire way to make profits. It would be best to view this pattern in conjunction with other technical indicators like the RSI and moving averages before making trading decisions.


