Establishing the support and resistance levels on any chart is a fundamental part of trading. Being able to identify them forms the basis of several more advanced trading strategies. It is also important to learn about them because they can help you make better and more accurate price predictions. And we’re here to help you do just that.
What is support?
Every asset responds to changes in demand and supply in the market. When there’s more supply and less demand, prices drop. The lower they go, the more attractive the asset becomes to buyers. At some point, the buying volume is large enough to overtake the selling pressure. That’s the point when prices stop falling and start trending upwards. In other words, at this point, the buyers are offering “support” to the price.
The point at which the switch happens is called a support level—the level where prices stop falling and reverse. And support is the area on a price chart that shows buyers’ willingness to buy.
What is resistance?
Resistance is the exact opposite of support.
Prices move up because there’s more buying than selling pressure. However, at one point, the price may go high enough for sellers to start making a profit. Or the buyers may decide they’ve hit their targets and don’t want to go any further. A third scenario may involve other buyers realizing that the coin is too overpriced and, therefore, not initiating new positions. Irrespective of which of these scenarios unfold, the trend reverses, and the chart dips.
The point at which this reversal happens is called the “resistance.” Because the market “resists” further price appreciation beyond the point of reversal.
How to identify support and resistance levels
Technical analysis is not an exact science. So, there’s no static point to consider the support or the resistance on a chart. And no matter what level one chooses, prices will sometimes drop below or reach above the support or resistance lines. But here are some ways you can—more or less—figure out where they probably lie.
Historical price data
To find out where a support or resistance level lies and whether it is valid, the line has to be tested multiple times. This may be done by referring to historical price data. Traders often use trendlines from past price movements while making predictions.
For instance, BTC registered an all-time high of $69,042 on 10 November 2021. However, soon after, the price fell drastically. So the next time prices come near that all-time high, traders will anticipate another resistance.
We encourage you to use smaller time frames, like 15 minutes when you’re starting to do this. Once you have some experience, you could move on to a larger time frame. If the lines coincide, they could act as pretty strong indicators.
Technical indicators
Other indicators, like the Fibonacci (or simply “fib”) retracement, are also used to determine support and resistance. This type of analysis is done when enough data points are not available from previous movements. Such indicators usually rely on advanced mathematical models and other metrics to determine a rough support and resistance range.
Peaks and troughs
Traders using this method start by selecting the timeframe they wish to analyze. Next, they identify the highest peak on the chart along with the lowest point. Then they take some time to mark every peak and trough. If the market is experiencing an uptrend, the support level will be the higher one among the low peaks. And the resistance will be the higher high peak.
The opposite applies in the case of a market downtrend.
Moving averages
Moving averages are another technical tool used in the analysis. They say that a 100-period moving average is the strongest support for price in a candlestick chart. However, some traders find other moving averages just as useful too.
Trend lines
You may draw trend lines when at least three peaks or troughs represent a moving support or resistance level. A downward-moving line depicts a downtrend and vice versa.
Support and resistance reversals
Reversals are perhaps the most important characteristic of support and resistance. Here’s how they work.
Suppose Coin X experiences resistance at $100 and falls from that point after a long rally. The next time its price bounces back to the same number, the market has to decide whether to respect the previous resistance level and fall back or to break that resistance and push upwards. If it does the latter, the $100 resistance no longer holds. Instead, it acts as a support. So, should the price hit $125 and create a new resistance level, when it eventually comes back, it will find support at $100.
The same happens when supports are broken too. They become resistance levels when prices jump back again.
This is called the support and resistance reversal—the phenomenon of these lines reversing roles once they’re broken.
How to draw support and resistance lines
The lines on the chart representing support and resistance are called support and resistance lines.
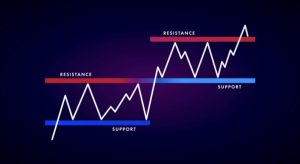
Refer to the picture below, for instance.
First, draw the lowest support, marked in blue, at the level from where the price line has bounced off recurrently. Usually, the price should have reversed or hesitated to continue its trajectory at least thrice around this level. The level represents the zone from where falling prices always seem to retreat.
Next, refer to the red and blue lines above this support level. This line is the resistance as well as the support for the next level above. You should draw it at the level where the white price line eventually breaks out of the red resistance.
So, to sum it up, simply identify where prices have repeatedly bounced back from.
The important point is that the price zones indicating where to draw the support or resistance levels should be well-spaced, time-wise. Because the farther apart two price action zones are, the better the support and resistance identification.
Also, short-term support and resistance levels are useful in intraday trades. And long-term is better for swing trading.
Conclusion
Technical analysis is hardly an exact science. Make sure you substantiate your predictions with other indicators and models. To make better-informed trading choices, solidifying your predictions with various indicators is key.
FAQs
How do you determine support and resistance levels?
Support and resistance levels can be determined in a variety of ways. One could connect peaks and troughs, draw trend lines, use previous time frames, or employ other indicators like the Fibonacci Retracement pattern.
How do you use trend lines with support and resistance?
Trend lines can often be used to draw support and resistance levels. More often than not, a moving line that’s heading downward depicts a downtrend and vice versa.
What is the best technical indicator to find support and resistance?
There is no such thing as the perfect technical indicator to find these levels. A combination of mathematical models, multiple time frames, and practice can make the process easier and more accurate.
Are trend lines the same as support and resistance?
Traders usually rely on horizontal or angled lines to highlight support and resistance. These lines are called “trendlines.” While these most often represent support and resistance levels, they can be used in other ways too.


