
Investors, analysts, and financial journalists spend a good amount of time trying to understand why markets moved. While they look primarily for news, technical analysts try to make sense of market movements by creating and interpreting charts.
Put simply, technical analysis involves analyzing price charts using different mathematical indicators and statistical tools to predict the near-term price movement of an asset. Technical analysis does not lack tools and indicators, yet only a few can match the powerful utility of the Moving Average Convergence Indicator (MACD). Read on to find out how this tool can help you spot profitable trades in the crypto market.
What is MACD in crypto?
The Moving Average Convergence Indicator (MACD) is an indicator usually used on candlestick charts while performing technical analysis of crypto and equities. The MACD comprises two lines, each representing Exponential Moving Averages (EMAs) of the coin’s price. Note that these lines are calculated by your charting tool in the background and are not displayed by default. The graph shown below will help you visualize how MACD works.
The resultant MACD line is calculated by subtracting the 26-period EMA from the 12-period EMA.
Another line accompanies the MACD line on a chart. This is a 9-day EMA, which is called the signal line. This is plotted on top of the MACD line, which can function as a trigger for buy or sell signals. Traders tend to buy the crypto when the MACD line crosses above the signal line and sell when it crosses below the signal.
The MACD comprises four components:
- The MACD line
- Signal line
- Zero line
- Histogram
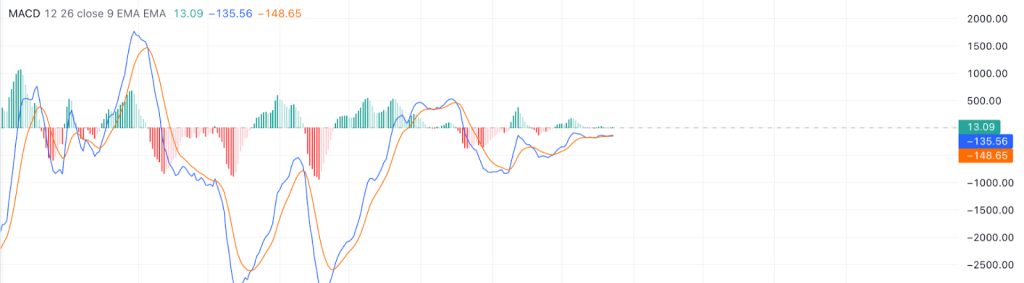
MACD indicator on BTC/USD chart: 23 Oct 2022
How does MACD work?
Now, let’s understand the MACD components in detail and how you can use them for crypto trading.
- You can calculate the MACD line by subtracting the 26-EMA from the 12-EMA. EMAs are generally used instead of regular moving averages to display sensitivities in price momentum more explicitly.
- The signal line is, by default, a 9-EMA. When combined with the MACD line, it can yield buy or sell signals. The convergence and divergence of these lines indicate positions a trader could possibly profit from.
- The zero line is simply the level at which the 26-EMA and 12-EMA would be the same, and the resultant MACD (26-EMA minus 12-EMA) would be zero.
Last of all, the histogram represents the distance of the MACD line from the signal line. When the MACD is above the signal (indicating a buy position), the histogram is positive. When the MACD falls below the signal (indicating a sell position), the histogram returns a negative pattern.
How is MACD calculated?
MACD=12-Period EMA − 26-Period EMA
Calculation
Here’s how you can derive individual components of the MACD calculator:
The MACD line
Calculated by extracting a long-term, 26-day exponential moving average (EMA) and deducting it from the values of a shorter-term, 12-day EMA. In a chart, this is usually painted blue.
MACD Line = (12-day EMA minus 26-day EMA)
The Signal line
This is a 9-day EMA that shows the turns of price movements in the short term. In a chart, this is usually painted red.
Signal Line = 9-day EMA of MACD Line
The Histogram
Helps to identify the difference between the two elements above.
(MACD line minus signal line)
How to use the MACD indicator in crypto trading?
Here are some classic signals to look out for when you are using the MACD indicator on your candlestick chart:
Signal line crossover
As the name indicates, this is based on the main MACD line’s positioning vis-a-vis the signal line. A crossover above the signal suggests a Buy trend, which means that prices could rise. Similarly, a crossover below the signal indicates a Sell trend, meaning prices could fall.
Zero line crossover
This signal is similar to the previous one. When MACD crosses the zero level, it turns positive, indicating a bullish trend, and vice versa. The farther the MACD line is from the zero line, the stronger the trend, sell or buy.
Watch out for rapid rises or falls
In fact, your observation skills can give you some valuable trading tips. Keep tabs on how fast the MACD lines are falling or rising. When the short-term EMA rises or dips more quickly than the long-term EMA, the trend becomes apparent between the two MACD averages. A rapid rise or fall signifies that the asset is either getting overbought or oversold and that prices could adjust in the short term.
Conclusion
We have seen that the MACD indicator, along with its components, is a powerful tool to gauge market momentum and help you decide on buying or selling. However, it is not advisable to depend on the MACD entirely for major trading decisions or devising long-term strategies.
Traders must validate their ideas with other trading indicators to ensure they’re making the right move. Even when combined with other positive indicators, profit-making is not certain, but the decision would be more balanced. As always, we encourage you to do your own research before investing in the crypto of your choice.
FAQs
How do you use MACD indicator in Crypto?
You can use the MACD (Moving Average Convergence Divergence) indicator in crypto trading to assess momentum and potential price trends.
What is the best setting of MACD indicator for Crypto?
Keep in mind that the MACD is just one tool among many for technical analysis, and it’s important to consider it in the context of other indicators and your overall trading plan
What is MACD and RSI in Crypto?
MACD and RSI are both valuable tools for crypto traders to assess trends and potential entry or exit points. Traders often use these indicators in combination with other analysis techniques to create a comprehensive trading strategy.
What is the best MACD indicator trading strategy?
Use proper risk management and consider your risk tolerance when implementing these strategies. It’s essential to practice and backtest these strategies before using them in live trading to ensure they align with your trading goals


