The cryptocurrency market is fast-paced and volatile, making real-time data crucial for traders and investors. Crypto heatmap offer an intuitive way to track price movements, volume changes, and market sentiment at a glance. In this guide, we’ll explore what crypto heatmaps are, how they work, and how you can use them to make informed trading decisions.
What is a Crypto Heatmap?
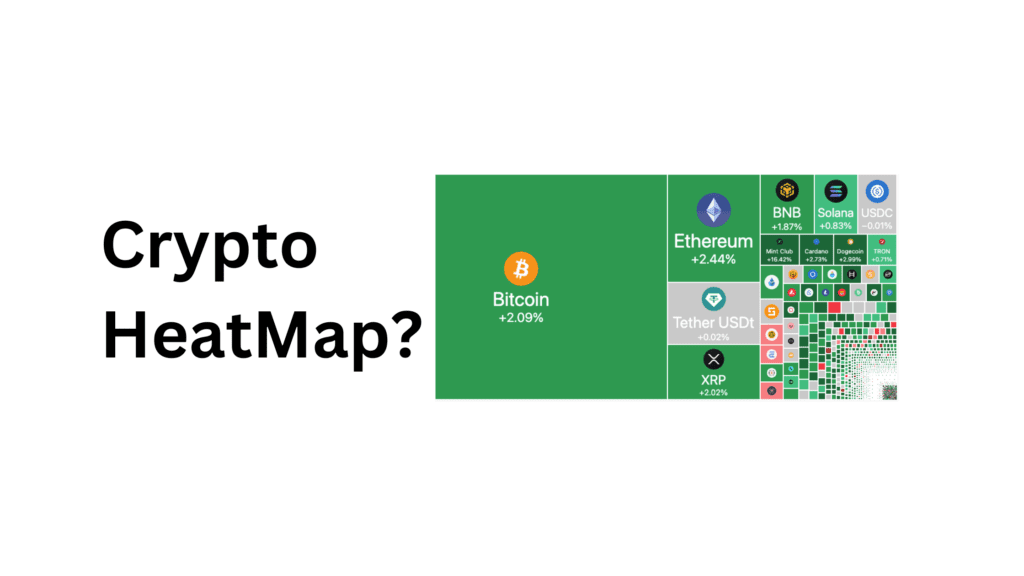
A crypto heatmap is a visual representation of market data where different cryptocurrencies are displayed in colored blocks. The color intensity indicates market performance, helping traders quickly assess trends.
- Green: Indicates price increases (bullish movement).
- Red: Indicates price decreases (bearish movement).
- Size of Blocks: Represents market capitalization or trading volume—larger blocks signify higher market activity.
Why Use a Crypto Heatmap?
1. Quick Market Overview
Instead of scanning individual charts, a heatmap provides a bird’s-eye view of price changes, allowing traders to spot market trends in seconds.
2. Identifying Trends and Patterns
Heatmaps help detect whether the market is experiencing broad bullish or bearish trends, aiding in decision-making for both long-term investors and short-term traders.
3. Real-Time Data for Better Decisions
Since the crypto market operates 24/7, real-time data is crucial. Heatmaps offer instant insights into price fluctuations, helping traders make timely moves.
How to Read a Crypto Heatmap
1. Colors & Market Sentiment
- A predominantly green heatmap suggests an uptrend.
- A red-dominated heatmap signals a downtrend.
- A mixed-color heatmap indicates market uncertainty or consolidation.
2. Market Cap and Trading Volume
- Larger blocks usually represent high-market-cap coins like Bitcoin (BTC) and Ethereum (ETH).
- Sudden volume spikes in smaller assets may indicate a breakout or strong market interest.
3. Sector Performance
Some heatmaps group assets based on categories such as DeFi, NFTs, Layer-1 blockchains, or meme coins—helping traders identify sector trends.
How to Use Crypto Heatmaps in Trading
1. Spotting Breakouts and Trends
A shift from red to green or vice versa can indicate trend reversals. Traders use these signals to enter or exit positions.
2. Market Sentiment Analysis
If major cryptocurrencies like BTC and ETH are in deep red, it may signal broader market fear, leading to caution in trading decisions.
3. Monitoring Altcoins and Emerging Assets
Smaller altcoins showing sustained green movement might be gaining momentum, presenting opportunities for early investment.
Final Thoughts
Crypto heatmaps are a powerful tool for visualizing market trends in real-time. By understanding color patterns, asset sizes, and sector performance, traders can gain an edge in navigating the ever-changing crypto landscape. Whether you’re a long-term investor or an active trader, using a heatmap can significantly enhance your decision-making process.


