Candlestick charts offer vital information about price movements on the basis of four factors—the opening price, closing price, and high and low prices for a fixed period. The spinning top is one of several patterns on candlestick charts. Like other patterns, the significance of this one, too, depends on its position on the chart. Read this article to learn more about how to use a spinning top candlestick pattern to trade crypto better.
Understanding the spinning top candlestick pattern
Having a good understanding of the spinning top pattern can take you a long way. But it is important to learn enough about it before using it to make trading decisions.
What is the spinning top candlestick pattern?
This candlestick pattern comes with a long upper and lower shadow and a small body at the center. It appears when the opening and closing prices of certain crypto are close to each other.
How to identify a spinning top candlestick pattern
Identifying a spinning top candlestick pattern is easy. You simply need to verify that:
1. The upper and lower shadow are of almost equal length.
2. There is a small body at the center.
It can be found at the top, bottom, or in middle of a range. And it can be both bullish or bearish.
A bullish spinning top forms when the close price is above the open price. And a bearish one makes its appearance when the close price is below the open price.
The significance of a spinning top candlestick pattern in crypto trading
The spinning top candlestick signals indecision among traders. It suggests that the bulls tried to push the price up while the bears tried to push it down, but both were unsuccessful. As a result, you will observe a small difference between the opening and closing prices of the crypto.
Spinning top candlestick pattern in crypto trading
Clues that chart patterns offer about the market trajectory can help you trade better. Many chart patterns, like the spinning top candlestick patterns, suggest the most profitable times to enter or exit a trade. The ability to spot and understand the significance of the spinning top pattern is very useful in crypto trading.
How to use the pattern to identify market sentiment
The spinning top candlestick pattern indicates that both bulls and bears are not in control. There is indecisiveness among traders. Such sentiments should be verified along with other indicators, though. Or you could look at the candlestick pattern that forms after the spinning top appears.
How to use the pattern to predict market trends
The spinning top pattern may appear anywhere on the chart. Depending on its position, it is possible to draw certain conclusions. But there are mainly three positions on the chart, so let’s break it down for you accordingly.
- Top of an uptrend: This usually means that an uptrend is about to end, and bulls are losing control.
- Bottom of a downtrend: When this happens, the downtrend is likely to reverse as the bears are not in power anymore.
- Middle of a range: This position suggests that both bulls and bears are not sure where to take the market. As a result, the range will continue.
Tips and tricks for using the spinning top candlestick pattern in crypto trading
The spinning top pattern is a technical indicator. The only tip one can offer is to apply it with other technical indicators. This will help verify the projections of the spinning top. More on this below.
Spinning top candlestick pattern in combination with indicators
For a more concrete understanding of the market situation, you could use a spinning top pattern with other indicators. Additionally, you could also verify changes that are about to take place after the pattern formation.
How to use the spinning top candlestick pattern in combination with indicators
Some indicators you could use along with a spinning top pattern are moving averages and the Relative Strength Index (RSI). Doing so will help confirm any reversals in the trend after the spinning top formation.
To do this, simply insert other indicators on the chart after spotting the spinning top. Check whether other indicators are in sync to confirm any changes in the post-top trend.
How to use the spinning top candlestick pattern in combination with moving averages
Moving averages is a technical indicator. It acts as a support or resistance level for the ongoing trend.
If a spinning top candlestick forms during an uptrend and is below the moving average, then trend reversal is possible. Similarly, if the spinning top is above the moving average during a downtrend, then the bullish turnaround is likely.
How to use the spinning top pattern in combination with support and resistance levels
One can easily draw support or resistance levels on a chart with previously formed candlesticks patterns. A spinning top forming over the support line indicates a bullish run. The converse is true if it appears under the resistance level.
Spinning top candlestick pattern and risk management
A spinning top candlestick pattern can also be used as a risk management tool. In other words, it can help mitigate risks arising from market volatility.
How to use the spinning top candlestick pattern in risk management
A spinning top indicates a potential reversal in an ongoing trend. If it forms during an uptrend and other indicators also confirm that the bears are taking over the market, crypto traders are probably going to be better off exiting their trades.
How to use stop loss and take profit levels in combination with the spinning top candlestick pattern
If during the downtrend, a spinning top pattern forms and one wants to take a long position, set the stop loss near the bottom shadow of the top. With profit levels, on the other hand, one takes a more dynamic stance and places the profit levels above the top candlestick shadow or even higher, as per one’s risk appetite.
How to use a spinning top candlestick pattern in combination with position sizing
A spinning top at the downtrend position can mean two things—either the beginning of an uptrend or the continuation of the downtrend. To minimize the risk exposure and get a sense of the market direction, one can buy assets worth 20% of their total investment. The limiting of position sizing helps avoid unnecessary losses.
Real-world examples and case studies
Real-world examples are always useful in understanding new concepts. Especially so with trading and investing. So here are some to make things extra clear.
Real-world examples of the spinning top candlestick pattern in crypto trading
Let’s begin with an example from Bitcoin. The weekly crypto candlestick chart below shows the formation of the spinning top pattern (inside the circle) during an uptrend. It is followed by a reversal in the ongoing trend.
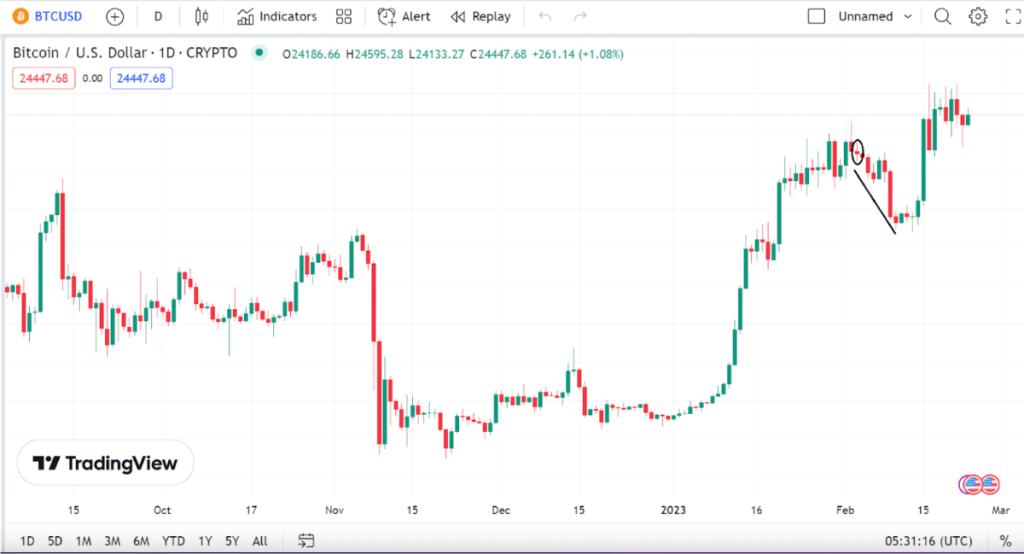
Source: TradingView
How to analyze and interpret the spinning top candlestick pattern
So to sum up all that we’ve been discussing. This is what you have to do to interpret this type of pattern:
- Look at the shape of the candlestick. Ask whether its shape matches the description of a spinning top.
- If yes, then look at its position on the chart.
- Also, use other indicators to verify the trend that the spinning sop is suggesting.
Conclusion
The spinning top candlestick pattern indicates indecision among buyers and sellers. Based on the position, a spinning top candle may or may not mean a reversal in the ongoing trend. Whatever your analysis, you should verify it by using other indicators before making any trading decisions.
FAQs
What does a spinning top candlestick indicate?
A spinning top candlestick indicates indecision in the market. Its small body and long wicks suggest that neither buyers nor sellers had full control during the period, possibly leading to a trend reversal or continuation.
How do you trade a spinning top candlestick pattern?
Trading a spinning top candlestick pattern involves waiting for confirmation. If it appears after a trend, monitor the next candle: an upward close could signal a bullish move, while a downward close might indicate a bearish shift. Combine with other indicators for stronger signals and manage risks with appropriate stop-loss levels.
What is the spinning top bullish pattern?
The spinning top bullish pattern is a spinning top candlestick that appears after a downtrend. It suggests potential trend reversal. If the next candle confirms with an upward move, it signals bullish sentiment and a potential shift in market direction.
Is a spinning top candle bullish or bearish?
A spinning top candlestick is neutral and doesn’t strongly indicate bullish or bearish sentiment on its own. It signals market indecision, suggesting a potential reversal or continuation depending on the following price action and confirmation from subsequent candles.


