
Fundamental analysis and technical analysis help people make better trades. But the former tries to determine an asset’s real value, while the latter seeks to identify a distinct price trend. The technical analysis primarily involves using several tools and indicators—particularly price charts. The Relative Strength Index (RSI) indicator is one among them. It is a tool that can help investors determine whether an asset is overvalued or undervalued.
What is RSI, and what is its importance in crypto trading?
RSI is a momentum indicator. It measures how much and how fast the price of a particular crypto changes. It also indicates whether the crypto or stock is being oversold or overbought. That information helps traders decide the direction of their trades.
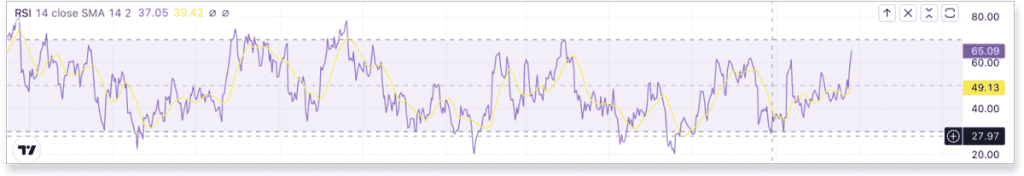
Visually, it is depicted as an oscillator (line) that moves in the 0–100 range, as visible in the graph above. If it goes above 70, the security is considered to be in the “overbought” zone, and if it dips below 30, the asset is said to be “oversold.” The 50 mark is considered neutral territory. An overbought asset could indicate an impending downtrend.The indicator is typically used with a 14-day timeframe in mind.
Professional traders use RSI to map high profitability trade entry points and reduce the risk of losses. However, one should not rely only on RSI. Confirming a trend using other momentum oscillator indicators like MACD, the stochastic indicator, and so on is important.
What does RSI tell us about crypto?
The RSI indicator is useful for all traders, particularly crypto traders. This is because crypto trends last only for a short time. The indicator works well in these conditions because it offers information on trends—telling traders whether a trend will continue or reverse.
But more specifically, the RSI can be used for the following:
- To identify the general trend of the crypto in question
- To look for divergences and failure swings
- To predict breakouts or breakdowns
The RSI thus gives signals that help you decide whether to take a bullish or bearish position.
Let’s work with an example to understand this better. Bitcoin’s momentum weakens if it makes higher highs on the hourly chart and the RSI makes lower highs. When this happens, Bitcoin’s price trend may reverse soon. Yet, traders must stay cautious as any long position can lead to losses.
On the other hand, if Bitcoin’s price is rising and the RSI indicator is also moving up from an oversold or neutral line, one can consider taking a long position and profit from the upside momentum.
How to use RSI for crypto trading
The RSI can be used as a trend validator or to identify divergence.
1. As a trend validator
As mentioned above, the RSI indicator can verify a trend before you make a trade. This may happen in one of the following ways.
- Uptrend validator: If the RSI stays above 30 during an upmove and peaks at 70, the crypto is riding an uptrend. On the other hand, if the RSI cannot hit 30 and consistently stays close to or above 70, a trend reversal and upward retraction may occur.
- Downtrend validator: If the RSI fails to stay at 70 and keeps falling below 50, you might be looking at a strong downtrend. Also, even if, during an uptrend, the crypto finds it difficult to touch 70 and occasionally drops a fair bit, a trend reversal might unfold.
2. To identify divergence
You could use the RSI indicator to choose entry and exit positions in the following ways.
- Exit point: When paired with another momentum indicator, the RSI helps monitor price movements and accurately identify trends. For instance, if the crypto price makes a higher low, but the RSI disagrees with a higher high, there may be a bearish divergence. That’s reason to consider exiting with profits.
- Entry point: If the crypto price makes lower lows, but the RSI indicator doesn’t drop as much and keeps making higher lows, there might be an upcoming upward trend or investment-specific entry point.
How to calculate RSI in crypto
The RSI calculation involves using the simple formula below.
RSI = 100 – [100 / ( 1 + (Average of Upward Price Change / Average of Downward Price Change )]
The RSI measures momentum by comparing the higher closing price of a cryptocurrency with its lower closing price. For instance, if ETH prices went up, they would likely have a higher RSI than a coin depreciating in the same timeframe.
Nowadays, RSI is calculated automatically via online price charts. You must just set the period as per your trading strategies.
How to interpret RSI values
Now that we know how to calculate the RSI, it is important to take a moment to try to understand what the value means. After all, knowing how to interpret the answer is half the answer itself.
What does a high RSI mean?
When an RSI indicator constantly moves above 70, the crypto or security is said to be overbought. Such an RSI is a sell signal. That means sellers are gaining the upper hand. The price of the crypto or security may begin to drop at this point until buyers gain control over it.
What does a low RSI mean?
When the RSI is low, the crypto is in an oversold condition or below 30. The price may soon bottom out and start moving higher slowly. When buyers gain control over the seller, the RSI moves toward the 70 level.
What is an RSI buy signal?
An RSI indicator above the neutral line (50), or one that has started moving higher from 30 or an oversold position and keeps making higher lows as it moves, is usually a buy signal. It indicates a good opportunity to trade.
Limitations of trading with RSI
Despite being a popular technical analysis tool, RSI has some limitations or pitfalls. They are:
- RSI can often move without displaying a clear trend for a long time in a market that’s going sideways. In such circumstances, other indicators could be more useful.
- Results from the RSI can be misleading when there’s a clear trend in the market. Therefore, it should only be used in a ranging market. Generally, it is better to combine multiple technical indicators rather than stick to one.
Comparing RSI and Bollinger bands
RSI combines with Bollinger bands to get strong reversal signals while trading oversold or overbought markets. As we have seen, it is an indicator that predicts future price actions. Bollinger bands, on the other hand, are a lagging indicator. That means the signal only triggers when there is some activity. So they involve trading by spotting reversals.
Bolinger bands have three constituents:
- Lower band
- Upper band
- 20-day moving average (the middle band)
With both Bollinger bands and day-trade crypto RSIs, the trader must wait for the price to hit the lower band, reaching oversold status and indicating a good entry point. Differentiating between RSI and MACDRSI and MACD are popular tools for identifying patterns in crypto price movements. While both offer traders signals, they function rather differently.MACD primarily helps analyze and infer the strength of price moves. It does this by looking at two Exponential Moving Averages (EMAs)—usually the 12-day EMA and the 26-day one. The main MACD line (usually depicted in blue) is based on the difference between the two EMAs.
The MACD indicator also includes other elements:
- A signal line (usually shown in red) represents the 9-day EMA of the same token.
- A zero line indicates where the MACD value would be equal to zero.
- A histogram to calculate the difference in value between the MACD and the zero line.
In contrast, the RSI does not just measure the strength of a price movement. It also determines whether a security is overbought or oversold vis-a-vis its current price.
So to sum it up, the MACD measures the relationship between two EMAs, while the RSI shows price change vis-a-vis the recent highs and lows. Analysts often rely on these two indicators to gather a technical market picture.
Conclusion
We always recommend that you base your trading decisions on multiple indicators. Employing multiple strategies and appropriate risk management procedures is a good idea. No matter how comprehensive RSI might be in theory, it remains vulnerable to market volatility. We encourage you to explore more indicators like MACD. A good combination helps make more profitable trades.
FAQs
What is an RSI indicator in crypto trading?
RSI (Relative Strength Index) is a technical indicator used in crypto trading to assess overbought or oversold conditions of an asset. It ranges from 0 to 100, indicating potential price reversals.
How can I use the RSI indicator in crypto trading?
You can use the RSI indicator in crypto trading by identifying overbought (RSI above 70) and oversold (RSI below 30) levels to time potential buy/sell signals and assess market momentum.
What is the best range for RSI?
The best range for RSI depends on the asset and market conditions. Generally, RSI between 30-70 is considered normal. Below 30 is oversold, above 70 is overbought.
Where can you find a Bitcoin RSI alert?
All online price chart websites, including tradingview.com, can help you track Bitcoin with an RSI. By setting up an alert, you can get real-time Bitcoin price alerts. You can get Bitcoin RSI alert notifications straight in your inbox or as push notifications.


