The head and shoulders pattern is a common and easy-to-spot technical analysis pattern that depicts a baseline with three peaks, with the highest center peak. The head-and-shoulders chart shows a bullish-to-bearish trend reversal and indicates an upward trend is closing.
Traders and investors can use the pattern because it occurs in all timeframes. The chart pattern offers significant and readily visible levels for entry levels, stop levels, and price targets, making the formation simple to implement.
Understanding the head-and-shoulders pattern
A head-and-shoulders pattern is a chart formation in technical analysis to suggest a price reversal in security. Historical pricing feeds the technical indicator and investors and analysts frequently use it to determine if a downward tendency is probable. Analysts often use the chart for stocks, but also for trading in forex, commodities, and crypto.
A head-and-shoulders pattern typically consists of an initial rally to a peak (the first shoulder), followed by a brief decline, which is then followed by another rally to an even higher peak (the head), after which the stock briefly declines before rallying to a third peak at roughly the same level as the first (the second shoulder). This third peak (and second shoulder) theoretically shows the beginning of a bearish breakdown or a long decline in an asset’s price.
Some investors and analysts use technical analysis and indicators like the head-and-shoulders pattern to analyze price movements, particularly during periods of high volatility and occasionally when there isn’t any news that could influence a company’s stock price.
What is an example of a head-and-shoulders pattern?
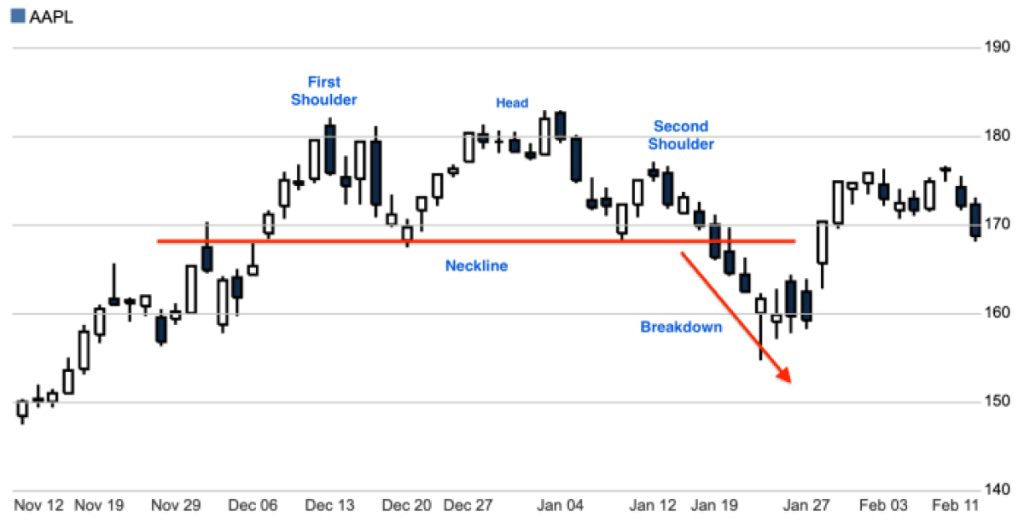
Let’s us understand the pattern with the help of an example. The movement of Apple’s stock price (Nasdaq: AAPL) from late 2021 to early 2022 is highlighted in the candlestick chart below, which displays daily intraday highs and lows as well as closing and opening values:

Early to mid-December marks the beginning of the first shoulder, during which the market rallies to its peak before beginning to fall in price. After hitting a low, it recovers and makes a new high toward the end of December before peaking, or making a head, in the first few days of January. After that, the stock falls before reaching a new bottom. The following rally reaches its apex and creates the second shoulder.
The view changes to bearish when the stock’s fall breaks through the same price level established after the first shoulder and the beginning of the second shoulder. The neckline is the level at those dips, and the breakdown is the stock’s downward slope. The breakdown in Apple’s case hits price levels that have not been seen since November. After the release of strong quarterly earnings and record sales, the stock remained stable before surging higher. The first and second shoulders’ peaks should preferably be at the same price levels, but this is not always the case.
What is an inverse head-and-shoulders pattern?
The inverse head-and-shoulders chart, also known as a head-and-shoulders bottom, is the reverse of a head-and-shoulders chart. It is inverted, and the bottoms of the head and shoulders forecast decline reversals. This pattern is identified when a security’s market action exhibits the traits listed below:
- The price reaches a low point before rising.
- The price increases after falling below the previous trough.
- After making the final trough, the price moves upward toward the opposition (the neckline) that you can see near the top of the previous troughs.
- The price declines once more but not as far as the second trough.
- Another reliable indication that a downward trend is about to change into an upward trend is the inverse head-and-shoulders pattern. In this instance, the market price experiences three successive lows, followed by brief rallies.
The second trough (the head) is the deepest, while the first and third are marginally deeper (the shoulders). The third dip’s final rally afterward indicates that the bearish pattern has changed, and prices will likely continue rising.
What are the limitations of a head-and-shoulders pattern?
The relative strength index and moving average are two momentum oscillators that one can use with the head-and-shoulders pattern. However, it is often a short-term trading tactic, and it can be challenging to forecast when a company will start recovering from a trend breakdown.
What is the typical length of a head-and-shoulders pattern?
The volume of a stock’s trading determines how long a candlestick design lasts. Little trading activity and modest everyday price changes could produce a pattern lasting several months. Within a few weeks, a pattern could emerge due to active trading and significant everyday price changes.
Traders use the head-and-shoulders pattern to spot market reversals. Three peaks make up a bearish head and shoulders, with the center peak rising higher than the other two. It denotes the conclusion of an ascending trend. Three troughs make up a bullish head-and-shoulders pattern, with the center trough being deeper than the other two. It shows that a downward tendency has reversed.
FAQs
What does head and shoulders pattern indicate?
The head and shoulders pattern in technical analysis indicates a potential trend reversal in financial markets. It consists of three peaks, with the central one (the head) signaling a trend reversal. This pattern suggests a shift from bullish to bearish or vice versa.
Is head and shoulder bullish or bearish?
The head and shoulders pattern is a bearish trend reversal pattern. It typically signals a shift from a bullish trend to a bearish one, indicating potential price declines ahead.
What is head and shoulder pattern in down trend?
The head and shoulders pattern in a downtrend is a reversal pattern. It forms after a prolonged decline and suggests a potential trend reversal to the upside, indicating a shift from bearish to bullish sentiment.
How accurate is head and shoulders pattern?
The head and shoulders pattern is known for its reliability, with an accuracy rate of around 81% to 85%, making it one of the more dependable patterns in technical analysis.


