- Trade


- Products

- Markets
- More
Login
Sign Up
Sign Up
Login
Sign Up
Sign Up
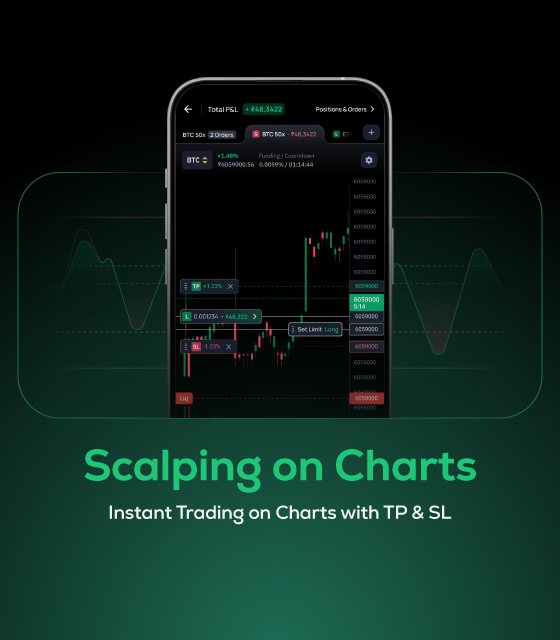
Crypto charts make it easier to understand how digital assets are performing in real time. By analyzing price trends, volume, and historical data, users can identify patterns and make more informed decisions in a constantly changing market. Whether tracking daily movements or long-term trends, they help users respond effectively to market changes.



For most users, interpreting charts can feel overwhelming at first. A well-designed INR chart experience simplifies this by presenting price trends, volume, and key data in a clear and accessible format. Instead of navigating multiple tools, everything is structured to help users focus on understanding movements and making informed observations.